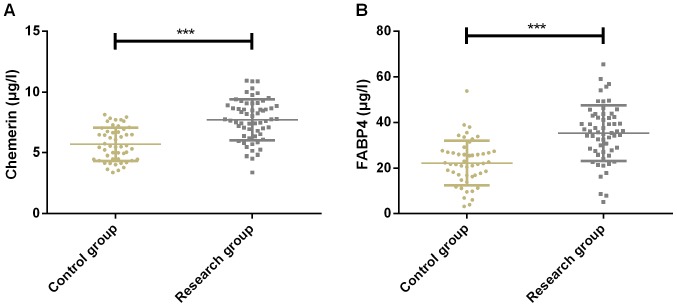
Figure 1.
Expression results of Chemerin and FABP4 of patients in the two groups. (A) The expression of Chemorin in SG was significantly higher than that in CG. (B) The expression of FABP4 in SG was significantly higher than that in CG. ***P<0.001 compared with the control group. FABP4, fatty acid-binding protein 4; SG, study group; CG, control group.

