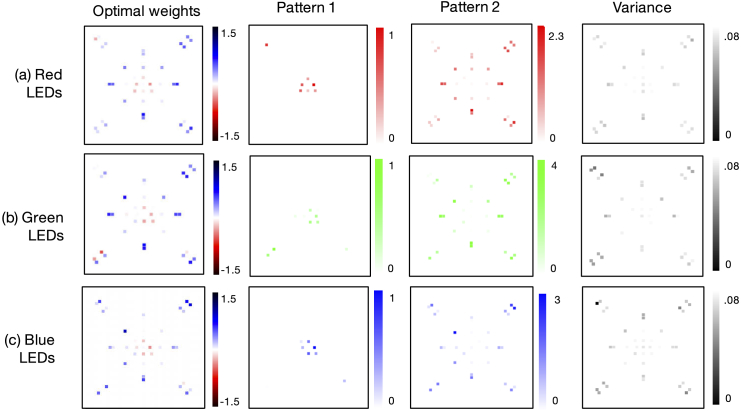
Fig. 8.
Optimal single-color illumination patterns determined by our network for thick-smear malaria classification (average over 15 trials). (a) Optimized LED arrangement determined using only the red spectral channel has (Pattern 1) negative and (Pattern 2) positive weights that lead to two LED patterns to display while capturing and subtracting two images. Variance over 15 independent runs. (b-c) Same as (a), but using only the green and blue spectral channels, respectively, for optimization.

