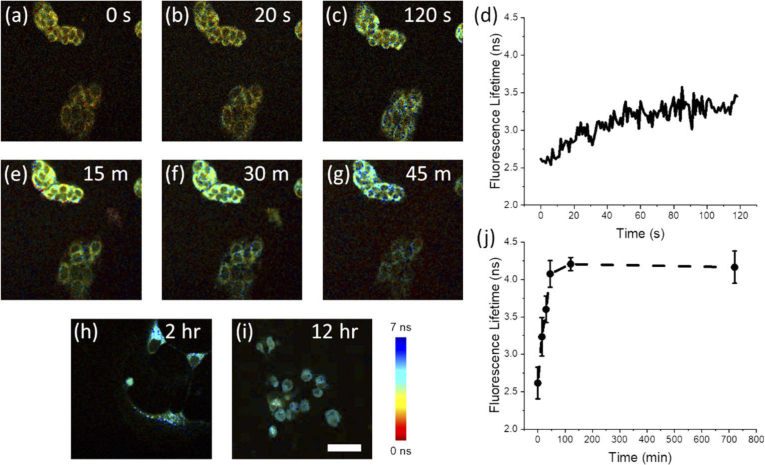
Fig. 1.
Longitudinal 2P-FLIM imaging of apoptosis induction in MCF-7 cells treated with 1 µM STS. (a-c) Short-term imaging of the same FOV (a) before treatment, and (b) 20 seconds and (c) 120 seconds following treatment. (d) Longitudinal trace of the lifetime averaged across cells in the FOV (N = 11 cells) from (a-c). (e-g) Imaging of the same FOV as (a-c) at (e) 15 minutes, (f) 30 minutes, and (g) 45 minutes post-treatment. Further imaging at (h) 2 hours and (i) 12 hours was performed in order to track long-term changes in NAD(P)H lifetime. (j) Long-term dynamics of apoptosis induction up to 12 hours. Scalebar is 50 µm.

