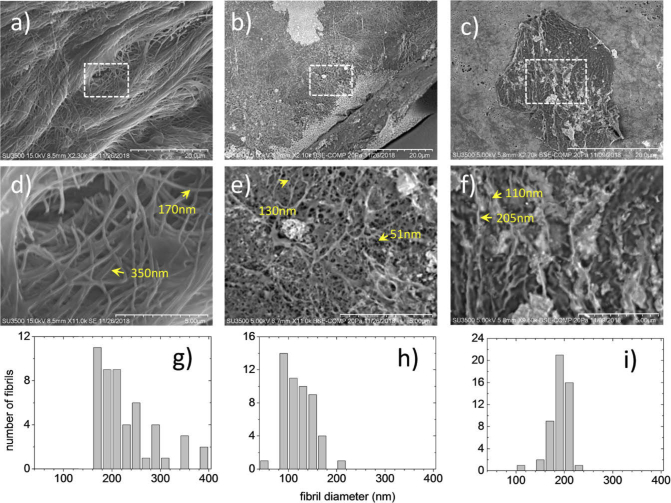
Fig. 6.
SEM imaging on a) native collagen fibers and collagen fibers grown in vitro at b) pH = 7.5 and c) pH = 7. d), e) and f) are zoomed images of a), b) and c), respectively, where thinner fibrils can be observed in collagen grown in vitro (see arrows). Histograms showing the distribution of the diameters measured on 50 native collagen fibrils (g) and 50 collagen fibrils grown in vitro at pH = 7.5 and pH = 7 (h,i).

