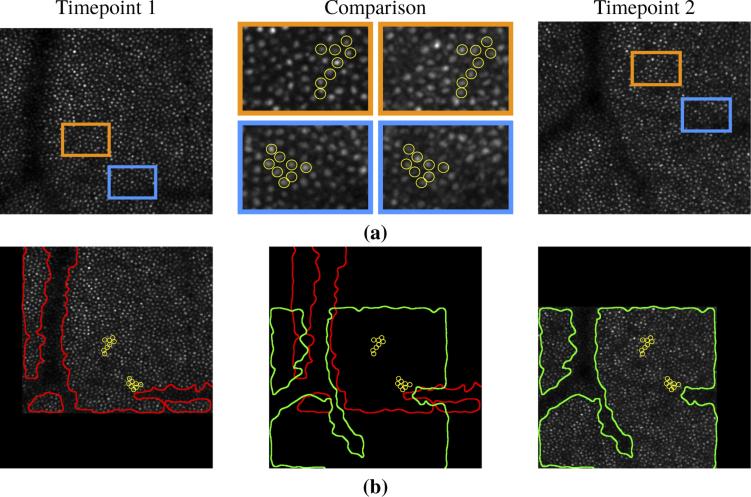
Fig. 1.
Examples of image differences between AOSLO images of the same subject and retinal location between two timepoints. (a) shows individual cone intensity changes (circled in yellow) across two timepoints. (b) shows the shift of vessel shadows (outlined in red and green) relative to the corresponding cone mosaics shown in (a). The vessel outlines were found semi-automatically by Gaussian smoothing each image and then adjusting a threshold to segment the vessel regions.

