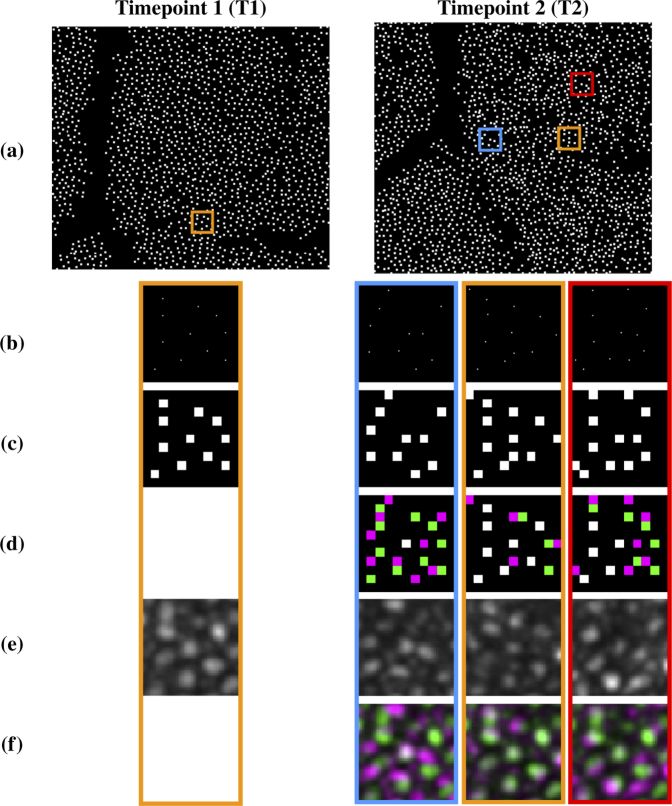
Fig. 2.
Visual example of how a constellation feature is constructed and compared between two images: (a) cone centers detected for the pair of longitudinal images shown in Fig. 1; (b) zoomed in regions of theboxes shown in each image in (a); (c) grid representation of the constellation feature for the center cone of each region shown in (b); (d) difference in the grid patterns for the orange region from Timepoint 1 and each region from Timepoint 2 (Green-T1 only, Magenta-T2 only, White-Both); (e) the original image intensities within each region; (f) difference in intensities within the orange region for T1 and each region for T2 (Green-T1 higher intensity, Magenta-T2 higher intensity, Gray-Similar intensities in both image). The region indicated by orange at T2 has the highest match score. Inspection of (e) and (f) indicates that it is a good match.

