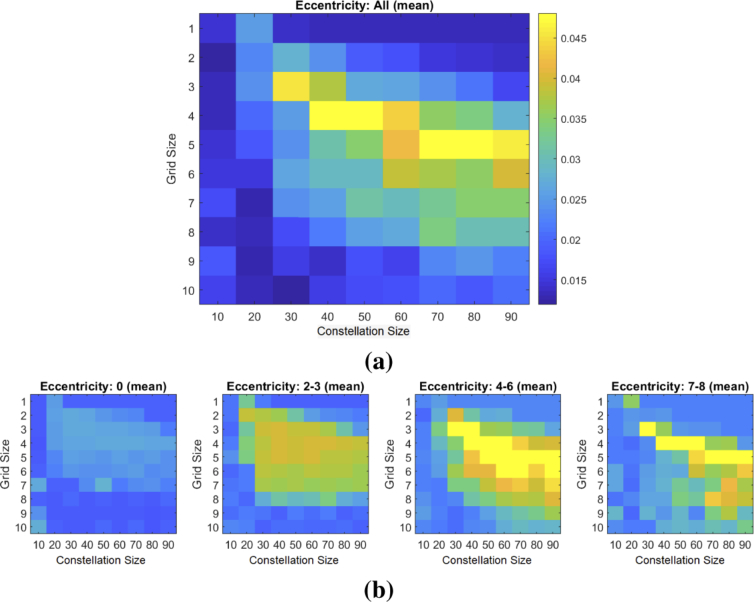
Fig. 6.
Matrices showing (a) the mean image similarity (NMI) after the alignment when using different constellation sizes (x-axis) and grid size (y-axis) for aligning the 20 development image pairs. (b) shows the mean image similarity when the image pairs are binned according to the eccentricity (in degrees) at which they were acquired.

