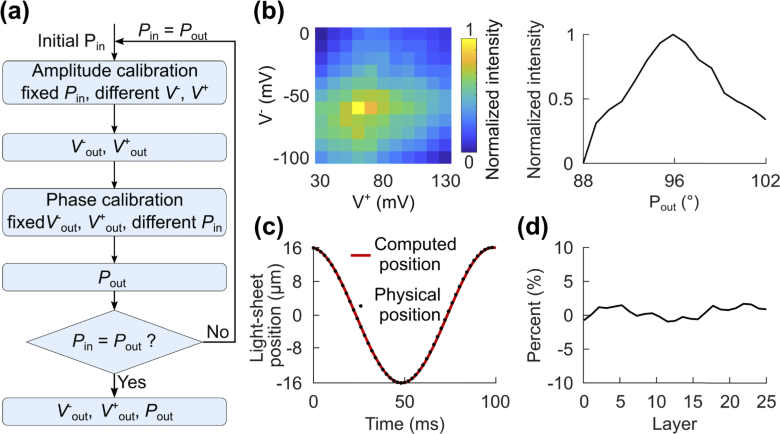
Fig. 2.
Dynamic calibration synchronized the displacement of the light-sheet with the focus shift of ETL. (a) The flow chart outlines the dynamic calibration procedures. Calibration of amplitude and phase identified the best peak voltage (V+out), trough voltage (V-out), and phase (Pout) for the sine wave applied to the galvo mirror. (b) Left: To calibrate the amplitude, we applied different peak and trough voltages in combination, and maximized the total pixel intensity over one cycle of the light-sheet scanning. Right: Once we obtained the optimal voltage input combination (V+out = 60 mV and V-out = −60 mV), we found the phase (Pout = 95°) that likewise maximized the pixel intensity. (c) The computed light-sheet position over one cycle of scanning matched the physical position determined by sample translation. (d) The intensity difference between the images taken in one half cycle using either the scanning-beam or the sample translational LSM was minimal.

