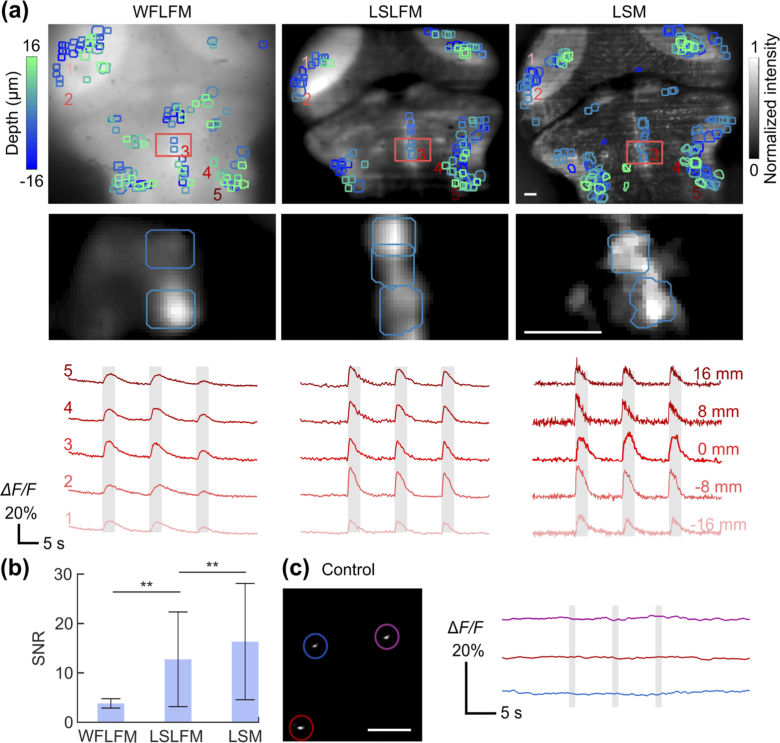
Fig. 7.
LSLFM imaging of the zebrafish brain during auditory stimulus improves the quality of recorded calcium transients compared to WFLFM. (a) Active neurons and the fluorescence traces acquired with WFLFM (left), LSLFM (middle) and LSM (right). Top row: Image of depth-encoded labeling of active neurons (colored masks) on top of brain structures (grayscale); Middle row: an enlarged view of the regions labeled with red boxes in the top images. The intensity corresponds to the normalized difference between the mean image of the frames with calcium transients and the mean image of the frames without neuron transients. Bottom row: Fluorescence traces from the same five representative neurons at different depths (−16 µm, −8 µm, 0 µm, 8 µm and 16 µm). Gray bars indicate auditory stimulus. (b) SNR comparison between neurons imaged with WFLFM, LSLFM, and LSM (mean ± std., n = 460, 558, and 648 neurons for WFLFM, LSLFM and LSM, respectively. ** p < 0.01, two-sided Wilcoxon rank-sum test). (c) Fluorescent beads imaged with LSM under the identical condition as the fish experiments. All scale bars are 20 µm.

