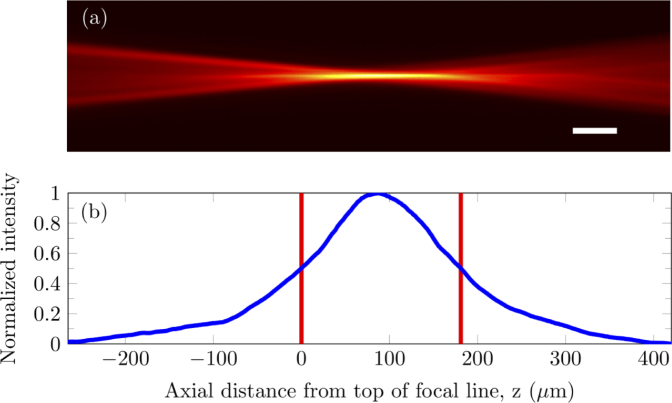
Fig. 2.
Experimental point spread function measured by imaging R6G fluorescence illuminated by the laser focal line. (a) Axial plane image of the PSF. (b) Fluorescence intensity profile along the axial axis, i.e. z axis, of the image. The intensity is shown in blue while the red lines indicate the edges of the FWHM. Scale bar: 50 µm by 9 µm.

