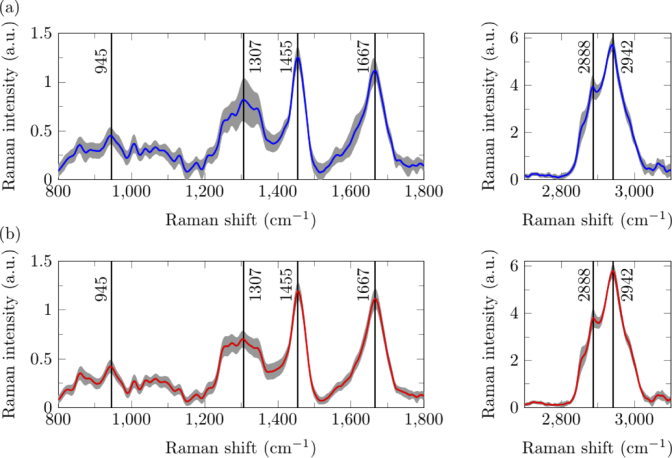
Fig. 6.
Raman spectra from rat skin (a) proximal and (b) distal to the wound site acquired by Ring 1. Averaged Raman spectra is shown in the blue and red colored lines while the variation in each spectrum is shown in grey, in which the upper and lower bound of each point in the shaded region indicates mean ± standard deviation. Black lines with text highlight specific Raman shifts (cm−1).

