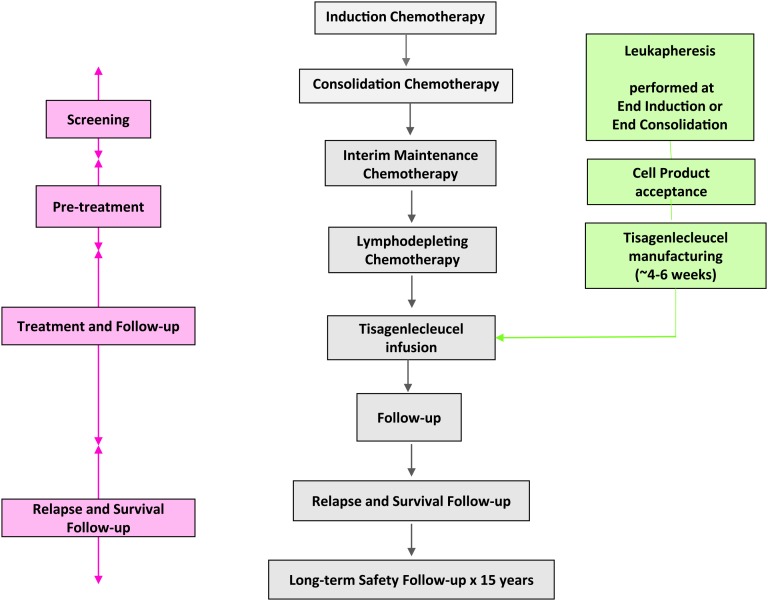
Figure 3.
Schematic diagram of COG study AALL1721. The center column shown in gray shows the blocks of patient treatment. The left column shown in pink indicates the different phases of treatment and follow-up. The right column shown in green shows the specific components of the CAR-T product manufacturing process and how the timing of manufacturing parallels the treatment phases. Schema modeled after and shown with permission of COG AALL1721 Study Chair Shannon Maude.

