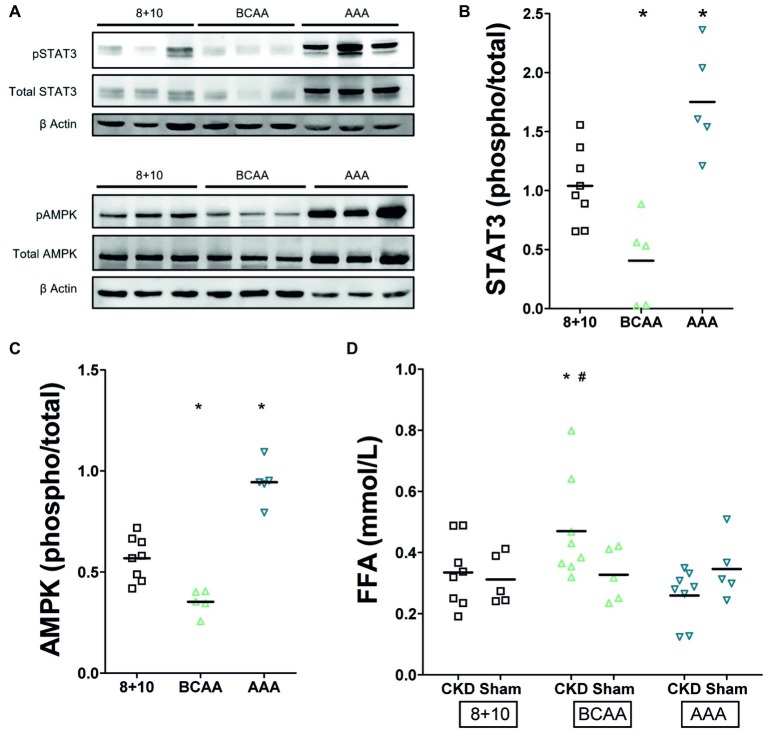
Figure 4.
Impact of CKD and amino acid diets on renal pSTAT3 and pAMPK and on plasma free fatty acids (FFA). (A) Western blot. Total and phosphorylated STAT3 appear as two bands of approximately 79 and 86 kD and AMPK as one band around 62 kDa. Both are possibly decreased under BCAA diet and clearly increased under AAA diet. (B) Quantitation of pSTAT3/STAT3 phosphorylation ratio (n = 5), *p < 0.05 compared to 8 + 10 animals. (C) Quantitation of pAMPK/AMPK phosphorylation ratio (n = 5), *p < 0.05 compared to 8 + 10 animals. (D) Plasma free fatty acids. There is no difference between CKD and control animals under 8 + 10 and AAA diets. The FFA are, however, elevated in CKD animals under BCAA diet. *,#p < 0.05 comparing to CKD and Sham animals, respectively, both under 8 + 10 diet (ANOVA with Dunnett post hoc test). Sham, n = 5; CKD, n = 8 animals per group.

