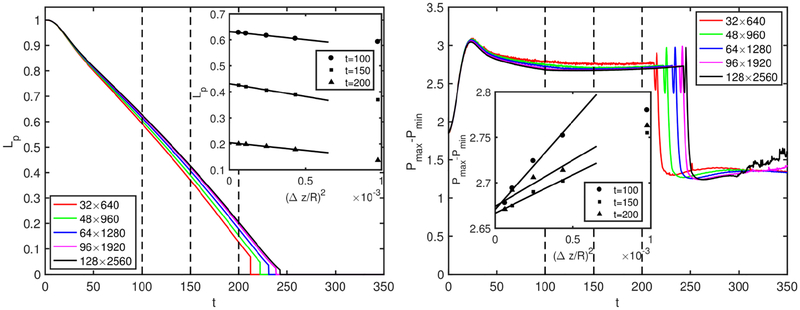
Figure 21.
Grid convergence. The time evolution of plug length (left) and the maximum pressure difference on the wall (right) computed using various grid resolutions ranging between 32 × 64 and 128 × 2560. The symbols in the insets show the respective values computed at the times indicated by dashed vertical lines for various grid sizes while the solid lines are the linear least-squares fits to the numerical value.

