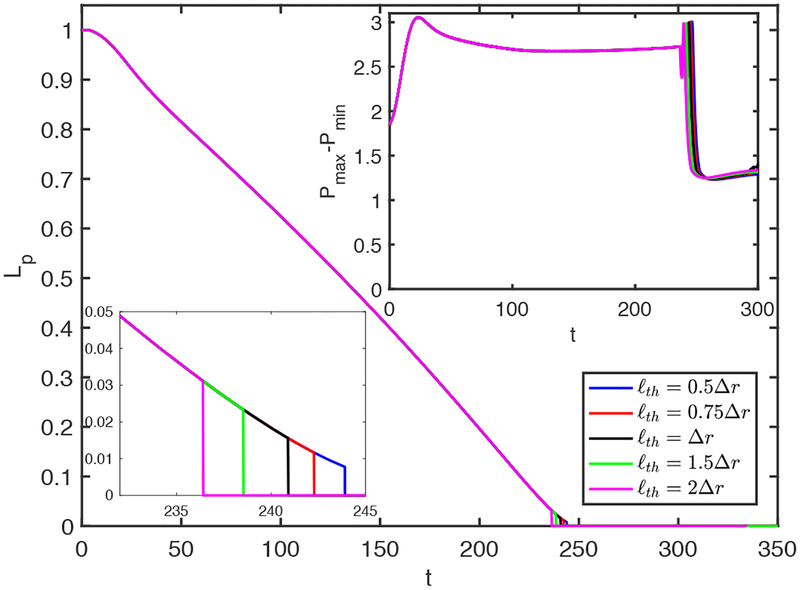
Figure 22.
The effects of the threshold distance (ℓth) used to rupture the plug in the range 0.5Δr ⩽ ℓth ⩽ 2Δr. The insets in the upper right and lower left corners show time evolution of the maximum difference in wall pressure (Pmax−Pmin) and the enlarged view of Lp around the rupture time, respectively. (C0 = 10−4, Lpi = 1.0, h2 = 0.05, Δp = 1, λ = 100, β = 0.7, χ = 0.01, Sc = 10, Scs = 100, Ka = 104, Kd = 100).

