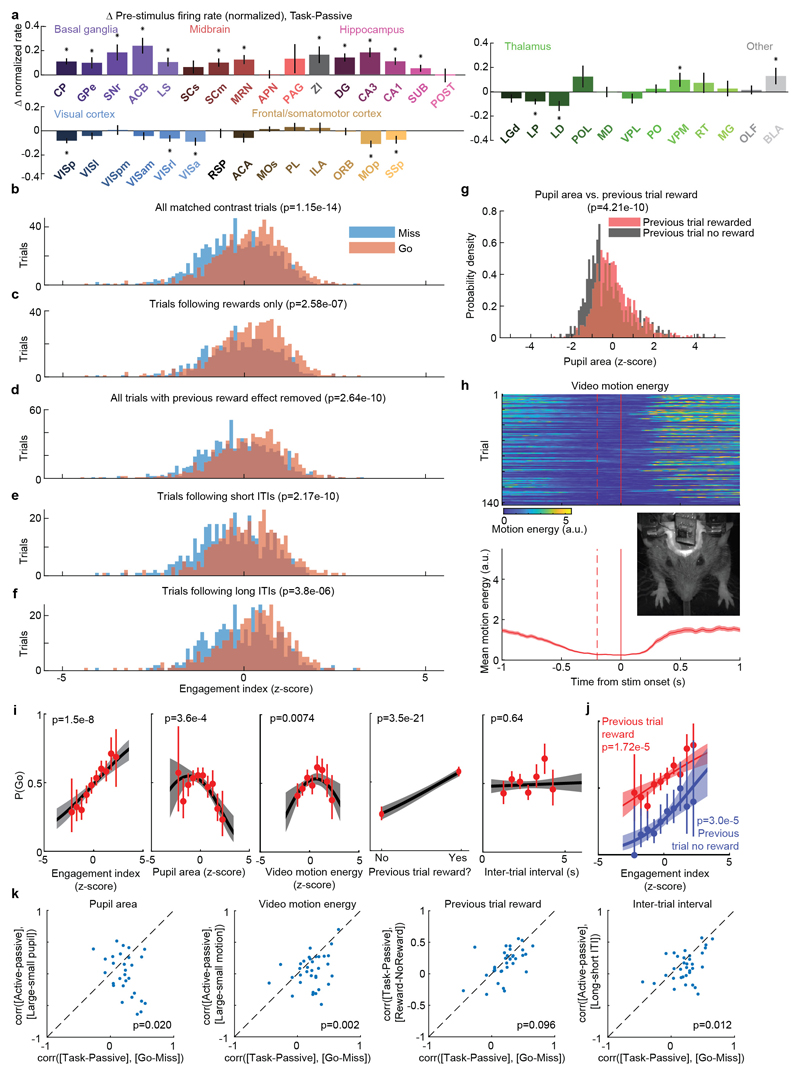
Extended Data Figure 9. Statistical analysis of Engagement Index, and influence of alertness-, reward-, and history-related variables on pre-stimulus firing rates.
a, A nested ANOVA with factors of session and subject was used to assess statistical significance of pre-stimulus task-passive firing rate differences (here normalized, unlike Fig. 5c-d and Extended Data Fig. 6b, to meet statistical assumptions) in each brain region (see Methods). All non-neocortical regions that showed a significant difference between engaged task and passive states had higher mean pre-stimulus firing rates in task context, except for visual thalamus. All neocortical regions that showed a significant difference between task and passive contexts had lower mean pre-stimulus firing rates in the task context. b, An engagement index was computed for each trial by projecting population activity onto the vector of differences between pre-stimulus activity in task and passive contexts. Histogram shows the distributions of this index over contrast-matched Miss and Go trials; p-value computed by t-test. c-f, Same plot after restricting to contrast-matched trials following rewards (c); after removing the reward effect by partial regression (i.e. by subtracting the mean within trials of each previous reward condition) (d); after restricting to contrast-matched trials following short inter-trial intervals (e) or after restricting to contrast-matched trials following long inter-trial intervals (f). The effect persists in each case. g, Histogram of pupil areas in the pre-stimulus period after previous trials that were rewarded or non-rewarded, showing the expected effect of reward on arousal as a positive control for the validity of pupil diameter measurements. h, To initiate the next trial, subjects must hold the wheel still for 500ms; video analysis shows they reduce other movements as well. Top, Total video motion energy (mean-square frame difference) as a function of time relative to stimulus onset, on each trial, for an example recording. Bottom, mean motion energy across these trials overlaid (red; shaded region represents s.e.m. across trials). Inset, example frame from video monitoring the face and arms of the mouse. i. Results of a logistic generalized linear model (GLM) predicting the probability of a Go response on the subsequent trial from each of the given variables; plot format as in Fig 5e. The null hypothesis that engagement index had no additional effect on Go probability over all other variables was rejected using a deviance test (p=1.5e-8). Each panel’s curve shows effect of one individual variable on Go probability. Red points: mean Go probability averaged over a bin, red error bars, 95% confidence interval. Black line, fit of GLM, setting all other variables to their mean; gray shading, 95% confidence interval. j. Average Go probability and GLM fit as a function of Engagement Index (x-axis), and previous trial reward (color). Correlation of P(Go) from Engagement Index persists despite the additional effect of previous trial’s reward. k, To additionally test whether engagement index more specifically relates to P(Go) than any other variable, we asked whether the engagement vector (i.e. the mean difference in pre-stimulus population activity between Task and Passive contexts) matches the population vector encoding differences prior to Go and Miss trials, better than it does differences in other behavioral variables. To do so, we computed the Pearson correlation between the engagement vector and the Go-Miss vector for each recording. This correlation coefficient can be interpreted as the cosine of the angle between the two vectors in Nneurons dimensional space. Each panel shows a scatter plot, with one dot per recording, comparing this correlation against the engagement vector’s correlation with vectors defined for each other behavioral variable. In each case we find that the correlation is greater for the Go-Miss vector (not reaching significance at alpha=0.05 level, however, for the comparison with the previous reward vector, p=0.096).

