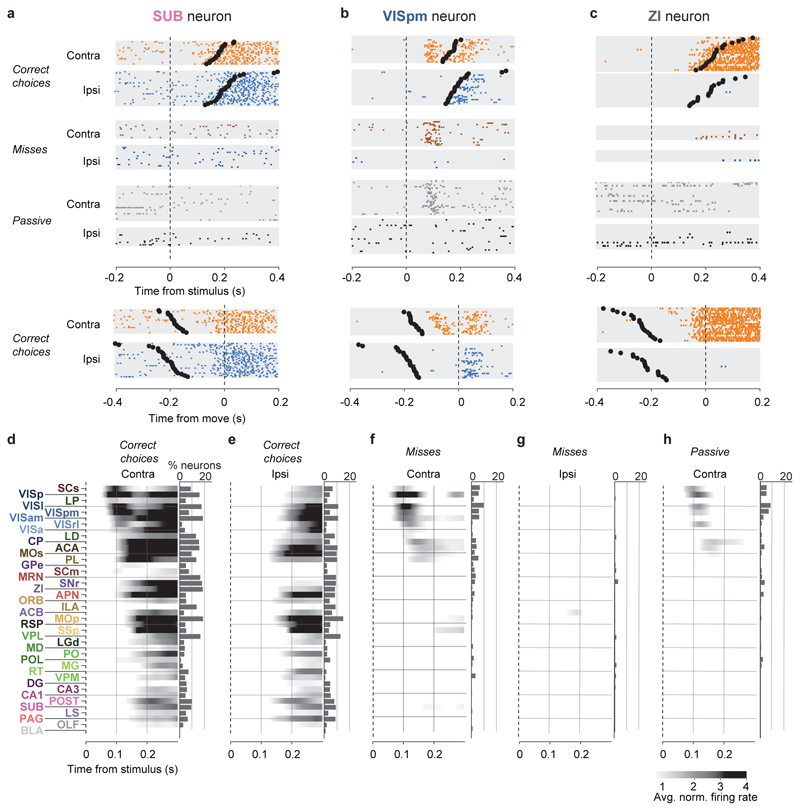
Figure 2. Activity propagates from a visual pathway to the entire brain during task performance.
a-c, Rasters showing activity of three example neurons following visual stimuli presented on the contralateral or ipsilateral side alone, on correct choice trials (when they evoked wheel turns in the correct direction), miss trials (when mice failed to respond in the task context), and when stimuli were presented in a passive context with no opportunity to earn reward. Top six panels: aligned to stimulus onset, black dots represent movement. Bottom two panels: aligned to movement, black dots represent stimulus onset. d-h, Colormaps showing firing rates averaged over responsive neurons in each region, and over trials of the indicated type. Contralateral visual stimulus contrasts were matched between d, f, and h so that differences in activity do not reflect differing visual drive. Subpanels to the right of each colormap represent the percentage of neurons in each area significantly more responsive during that condition than baseline, (p<10-4; see Methods).

