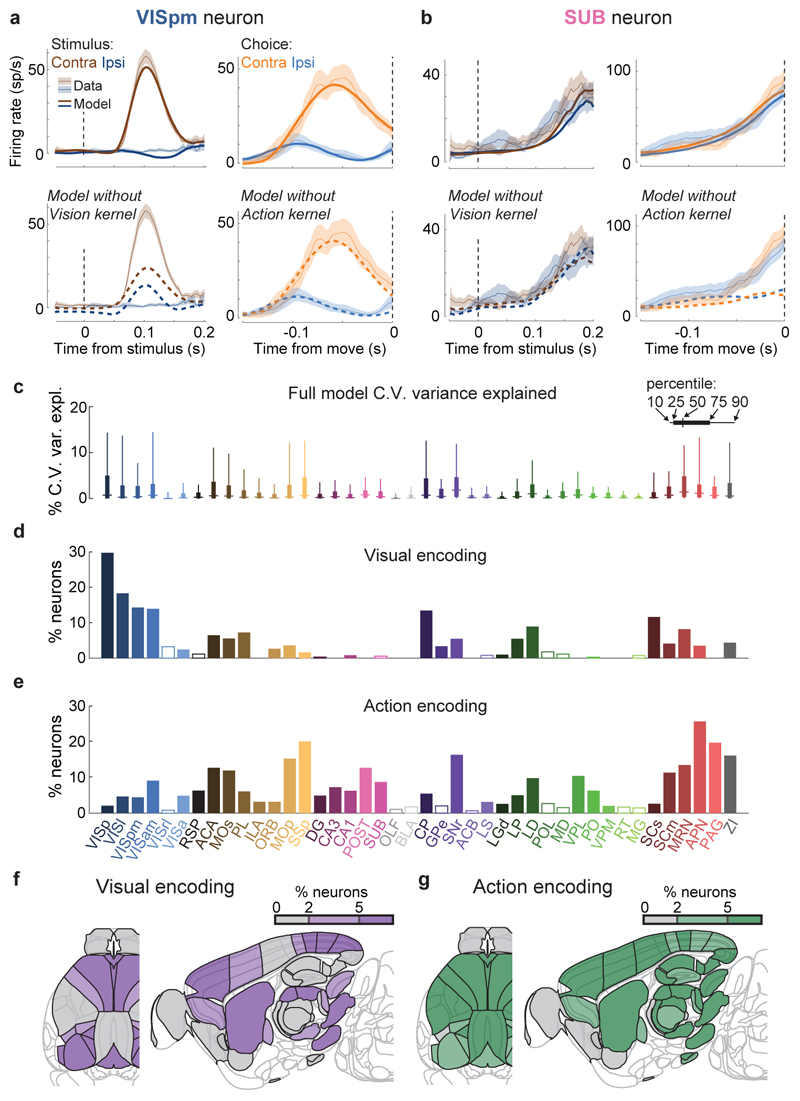
Figure 3. Neurons encoding vision are localized but neurons encoding action are found globally.
a. Example of regression analysis for the example VISpm neuron shown in Fig. 2b. Firing rate was averaged (solid thin line, mean; shaded regions, s. e. across trials) across the trial types indicated: all trials with contralateral stimuli (dark brown), with ipsilateral stimuli (dark blue); all trials with contralateral choices (orange), with ipsilateral choices (blue). Top plots show mean firing rate overlaid with cross-validated prediction of the regression model using all kernels (solid thick lines). Bottom plots show mean rate overlaid with fits excluding the indicated kernel (dashed lines). The good fit of the full model is lost when excluding the Contralateral Vision kernels, indicating that this neuron has stimulus-locked activity that cannot be explained by other variables. b, Similar analysis for activity of the SUB neuron from Fig. 2a, for which a good fit cannot be obtained when excluding the Action kernel. c, Box plots showing distribution of the percentage of spiking variance explained in cross-validated tests of the full model, for all neurons within each brain region. d, Fraction of neurons in each brain region for which accurate prediction of pre-movement activity required the Contralateral Vision kernel. Empty bars indicate those for which the number of neurons passing analysis criteria was < 5. e, as in (d) but for the Action kernel. f, Illustration of (d) on a brain map. White areas were not recorded. g, As in (f) but for the Action kernel. Brain diagrams were derived from the Allen Mouse Brain Common Coordinate Framework (version 3 (2017); downloaded from http://download.alleninstitute.org/informatics-archive/current-release/mouse_ccf/).

