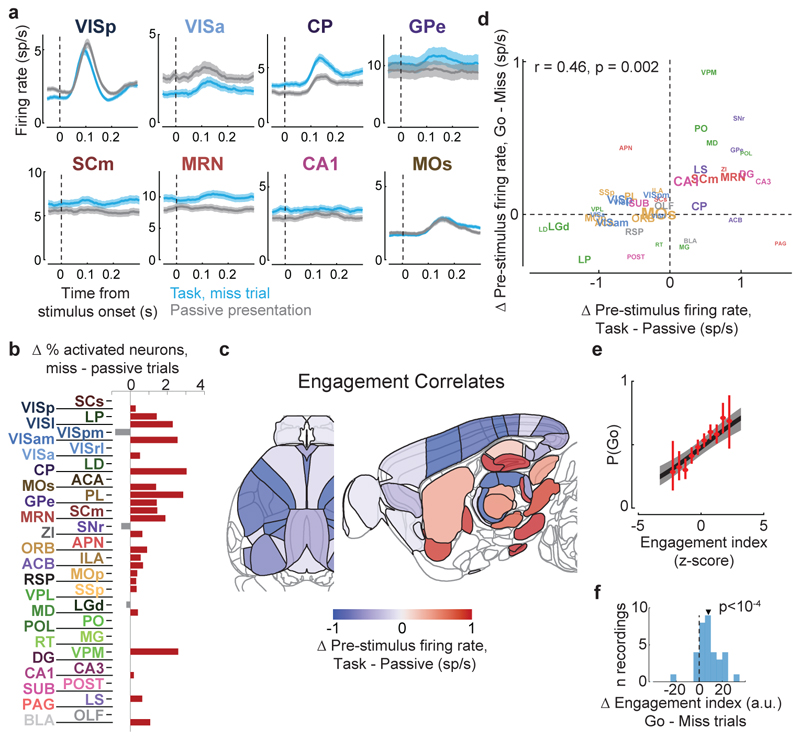
Figure 5. Task engagement correlates differently with cortical and subcortical activity.
a, Comparison of population average spiking activity for several brain regions, for task-context trials when contralateral stimuli were presented but subjects did not respond (i.e. ‘Miss’ trials, blue) and for stimulus presentations during the passive context (grey). Visual stimulus contrasts were matched between the two conditions. b, Excess fraction of neurons significantly activated in task context miss trials compared to passive condition, for matched contrast stimuli. c, Brain map showing difference in pre-stimulus firing rate between task and passive conditions, averaged over all neurons in each region. d, Scatterplot showing difference in pre-stimulus rate between task and passive contexts (x-axis) and between go and miss trials within the task context (y-axis), averaged over all neurons in a region. Text size indicates number of neurons in the analysis (range 130-1534). e, On each trial, an engagement index is computed by projecting pre-stimulus population activity onto a vector defined by the each neuron’s rate difference between task and passive contexts. The graph shows probability of Go response as a function of z-scored engagement index. Red: movement probability for each bin of engagement index (error bars: s.e.m. across trials). Black: logistic regression fit with 95% confidence bands (gray). f, Histogram of differences in pre-stimulus engagement index for Go versus Miss trials for each recording. Inverted triangle represents the mean value across recordings (mean = 8.42 a.u.). Brain diagrams were derived from the Allen Mouse Brain Common Coordinate Framework (version 3 (2017); downloaded from http://download.alleninstitute.org/informatics-archive/current-release/mouse_ccf/).

