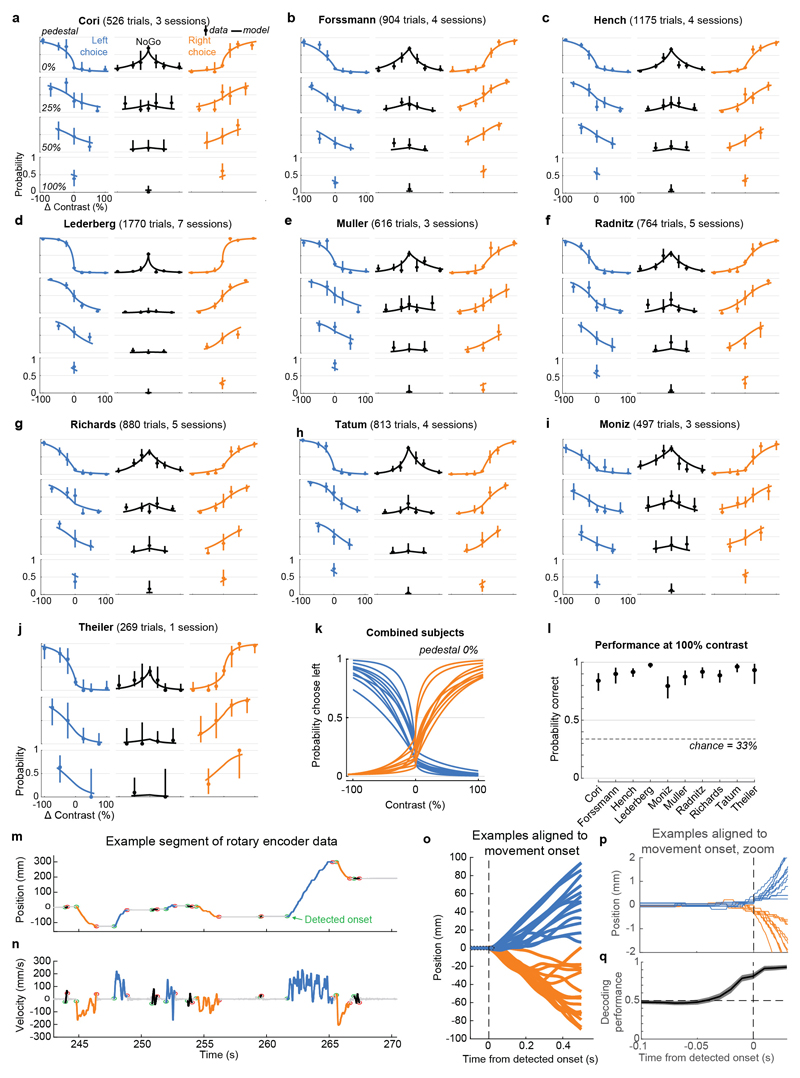
Extended Data Figure 1. Behavioral performance as psychometric curves for each subject, and analysis of wheel movements.
a, Psychometric curves for mouse Cori, showing the probability of choosing Left (blue), Right (red) or NoGo (purple) as a function of stimulus contrast. Panels are grouped by pedestal contrast on each row, corresponding to subsets of trials with different minimum contrast on the left and right screens. The horizontal axis encodes the relative contrast from the pedestal value, positive numbers indicating higher contrast on the right screen, and negative numbers for higher contrast on the left screen (e.g. at pedestal=50%, a ΔContrast of +50% corresponds to trials with 50% contrast on the left screen and 100% contrast on the right screen). Dots and lines indicate the empirical fraction of choices made and 95% binomial confidence intervals for the fraction estimate, pooling data over sessions. Solid lines indicate the fit of a multinomial logistic model: where cL and cR are the contrast on the left and right, and parameters bL, sL, n, bR, sR are fit by maximum likelihood estimation to the data for each subject3. b-j, As in a, for the remaining subjects. k, The model fit for all subjects overlaid, for Left choices (blue) and Right choices (orange), in both cases for pedestal=0%. l, Summary of performance on high-contrast trials. Dots reflects the session-pooled proportion correct of each mouse for trials with 100% versus 0% contrast, with 95% binomial confidence interval. m, Example segment of wheel position data showing wheel movements detected as left turns (blue), right turns (orange), or incidental movements (black). Detected onsets (green circles) and offsets (red circles) marked for each movement. Y-axis scale: distance moved at the circumference of the wheel (i.e. 2πRθ where R is wheel radius and θ its angular position). n, Wheel velocity trace for the same segment of data as in a. o, Example wheel turns aligned to the detected onset time. Dashed box indicates the region expanded in d. p, Example wheel turns aligned to detected onset time, zoomed to show the moment of takeoff, illustrating that the wheel had moved by less than 0.5mm by onset. The step-like appearance of the trace reflects the resolution of the rotary encoder (each step unit is 0.135 mm at the surface of the wheel). q, Decoding the eventual direction of the wheel movement using the instantaneous velocity at different times relative to detected movement onset reveals that the direction only starts to be decodable around 20 ms prior to detected onset, and is not reliably (>80%) decoded until the time of onset. Error bars represent s.d. across sessions (n=39).

