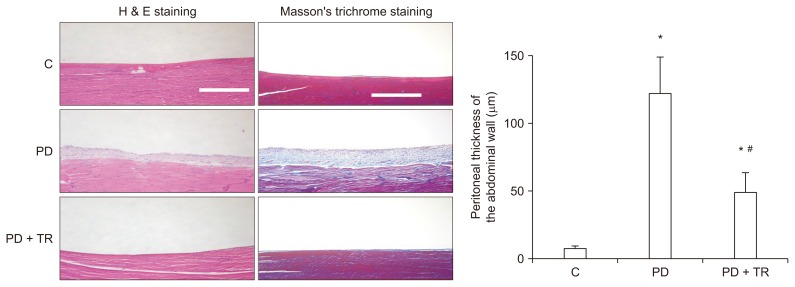
Figure 5.
Morphological changes in the peritoneum.
Histopathology was assessed 6 weeks after initiation of peritoneal dialysis in rats. Hematoxylin and eosin (H&E) staining revealed that the peritoneal thickness of the abdominal wall was greater in the peritoneal dialysis (PD) group than in the C group (magnification 100×; white scale bar, 100 μm) and was lesser in the PD + TR group than in in the PD group. Masson’s trichrome staining (magnification 100×; white scale bar, 100 μm) revealed similar results. Data for peritoneal thickness are expressed as mean ± standard error. The n values for the C, PD, and PD + TR groups were 8, 12, and 12, respectively.
C, control; PD + TR, peritoneal dialysis group with tranilast cotreatment.
*P < 0.05 compared to the C group at 6 weeks, #P < 0.05 compared to the PD group.

