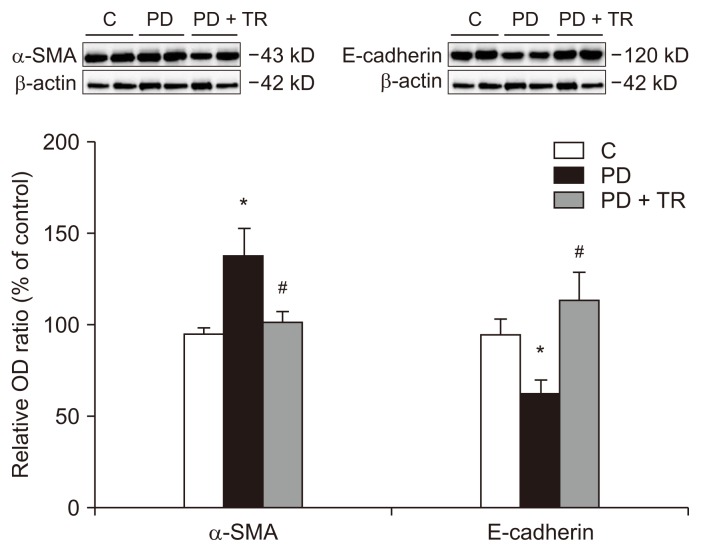
Figure 6.
Epithelial-to-mesenchymal transition markers in the parietal peritoneum.
Western blot analysis of the parietal peritoneum was performed 6 weeks after initiation of peritoneal dialysis in rats. Quantification is relative to the control and normalized to β-actin expression. The protein expression of α-smooth muscle actin (α-SMA) was greater in the peritoneal dialysis (PD) group than in the C group, while the protein expression of E-cadherin was lesser in the PD group than in the C group. These changes were reversed in the PD + TR group. The relative optical density (OD) values are expressed as mean ± standard error. The n values for the C, PD, and PD + TR groups were 8, 12, and 12, respectively.
C, control; PD + TR, peritoneal dialysis group with tranilast cotreatment.
*P < 0.05 compared to the C group, #P < 0.05 compared to the PD group.

