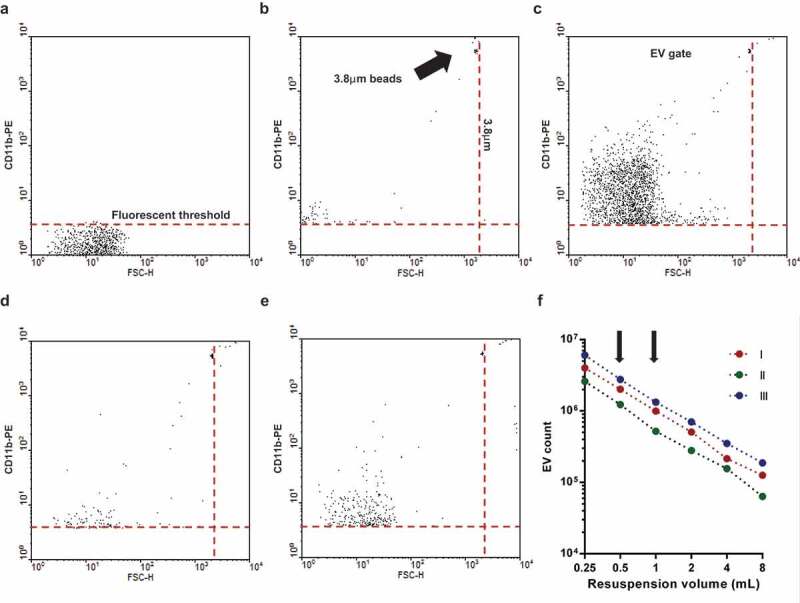
Figure 1.

Gating strategy of flow cytometric (FC) EV detection. Representative dot plots of FC measurements. a. Fluorescence threshold was set in pure HBSS in the yellow fluorescence channel (585 nm) against forward scatter plot. b. Spherotech beads (3.8 μm) were used to set the upper size limit of EV gate. c. Representative dot plot of CD11b PE labelled EV. d. Representative dot plot of isotype PE antibody labelled EV. e. Representative dot plot of 0.1% Triton X-100 treated CD11b PE labelled EV. f. Relation of EV count to serial dilution. The x axis indicates the final volume used for resuspension of the sedimented EVs. Three representative measurements. The arrows indicate the dilution used routinely.
