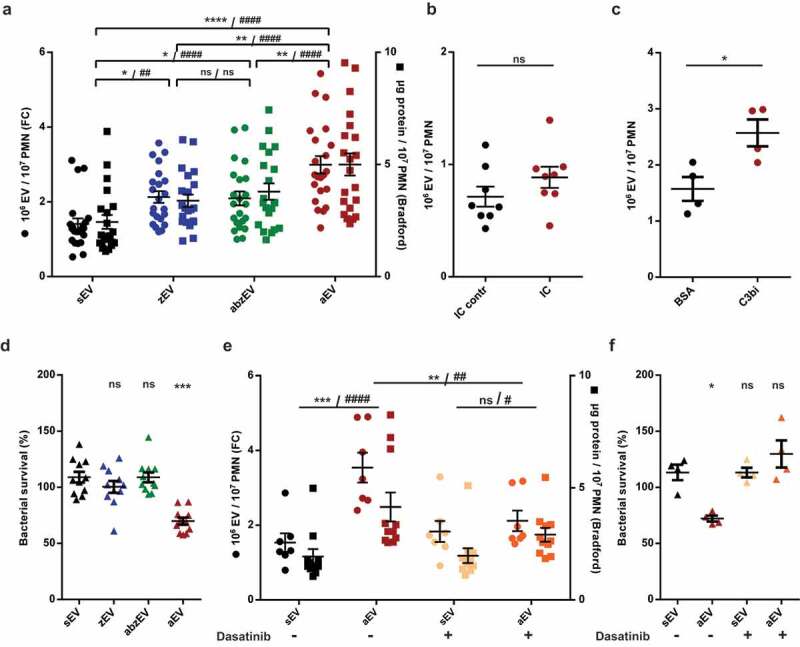
Figure 2.

Complement receptor activation induces aEV production in human PMN. a. Quantification of EV production by flow cytometry (FC, left axis) and protein amount measurement (right axis) after activation with non-opsonized (zEV), partially (abzEV) or completely (aEV) opsonized zymosan. Data were compared by using two-way ANOVA coupled with Tukey’s post hoc test; n = 22, 26. Level of significance is indicated by * for EV numbers and by # for protein amount. FC quantification of EV production by adherent PMN on immune complex (IC) surface (b.) and on C3bi or bovine serum albumin (BSA) surface (c.). C3bi or bovine serum albumin (BSA) surface. Data were compared using paired Student’s t-test, n = 8 and 4. d. Bacterial survival in the presence of different types of EVs released from 5 × 10⁶ PMN. Data were compared to sEV using RM one-way ANOVA coupled with Dunnett’s post hoc test; n = 11. e. Quantification of EV production (left axis) and protein amount measurement (right axis) from PMN pretreated without or with dasatinib. Data were compared by using two-way ANOVA coupled with Tukey’s post hoc test; n = 7,11. Level of significance is indicated by * for EV numbers and by # for protein amount. f. Quantification of bacterial survival in the presence of aEV from PMN preincubated without or with dasatinib. Data were compared to sEV using RM one-way ANOVA coupled with Dunnett’s post hoc test n = 5.
