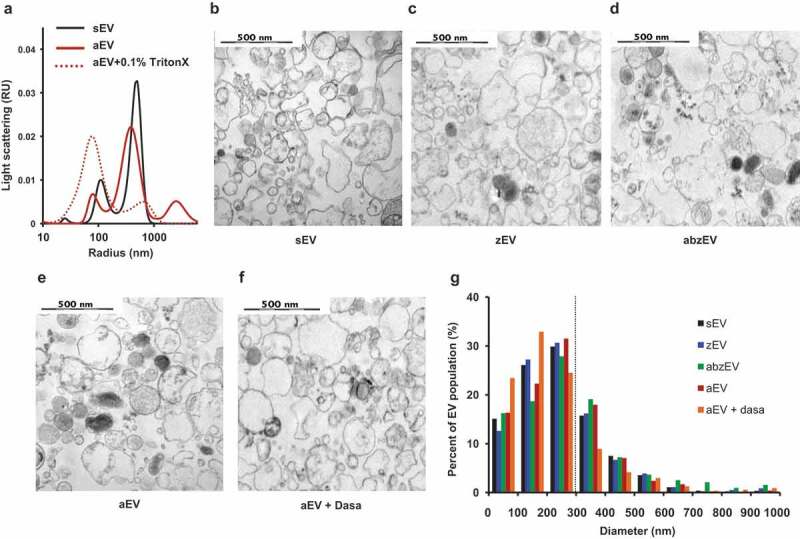
Figure 3.

Characterization of EVs derived of human PMN. a. Size distribution spectra of EVs measured by DLS. Broken line represents 0.1% Triton X-100 treated aEV. Signal above 1000 nm is due to zymosan contamination. Representative pictures of one out of three similar experiments. Representative electron microscopic images of human sEV (b.), zEV (c.), abzEV (d.), aEV (e.), and aEV prepared from dasatinib pretreated PMN (f.). Original magnification is 30,000×, representative pictures out of three similar experiments. g. Size distribution spectra of human EVs based on electron microscopy images of one representative experiment, data originate from 400 EVs pro samples. The dotted line represents the possible limit of detectability by flow cytometry.
