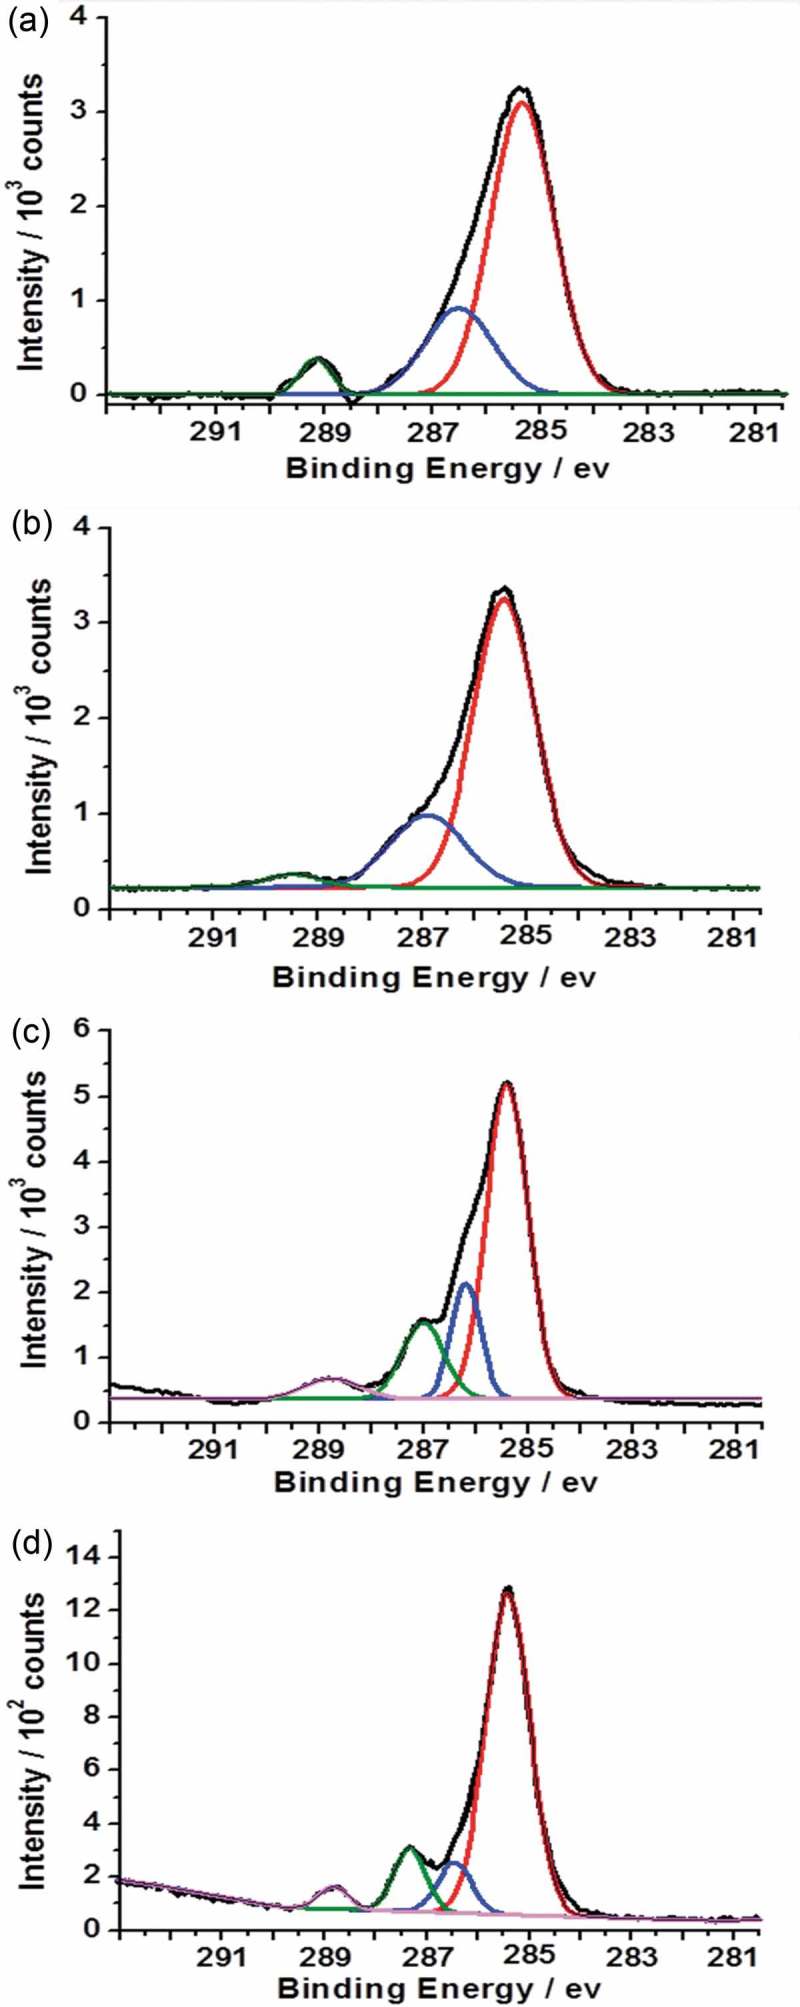
Figure 5.

X-ray photoelectron core-line spectra recorded for a series of PTBAEMA brushes grafted on MSNs. (a) C1s spectrum obtained for MSN-PTAEBMA. (b) C1s spectrum obtained for surface-quaternized of MSN-PTBAEMA (for 1 h). (c) C1s spectrum obtained for surface-quaternized of MSN-PTBAEMA (for 3 h). (d) C1s spectrum obtained for surface-quaternized of MSN-PTBAEMA (for 24 h).
