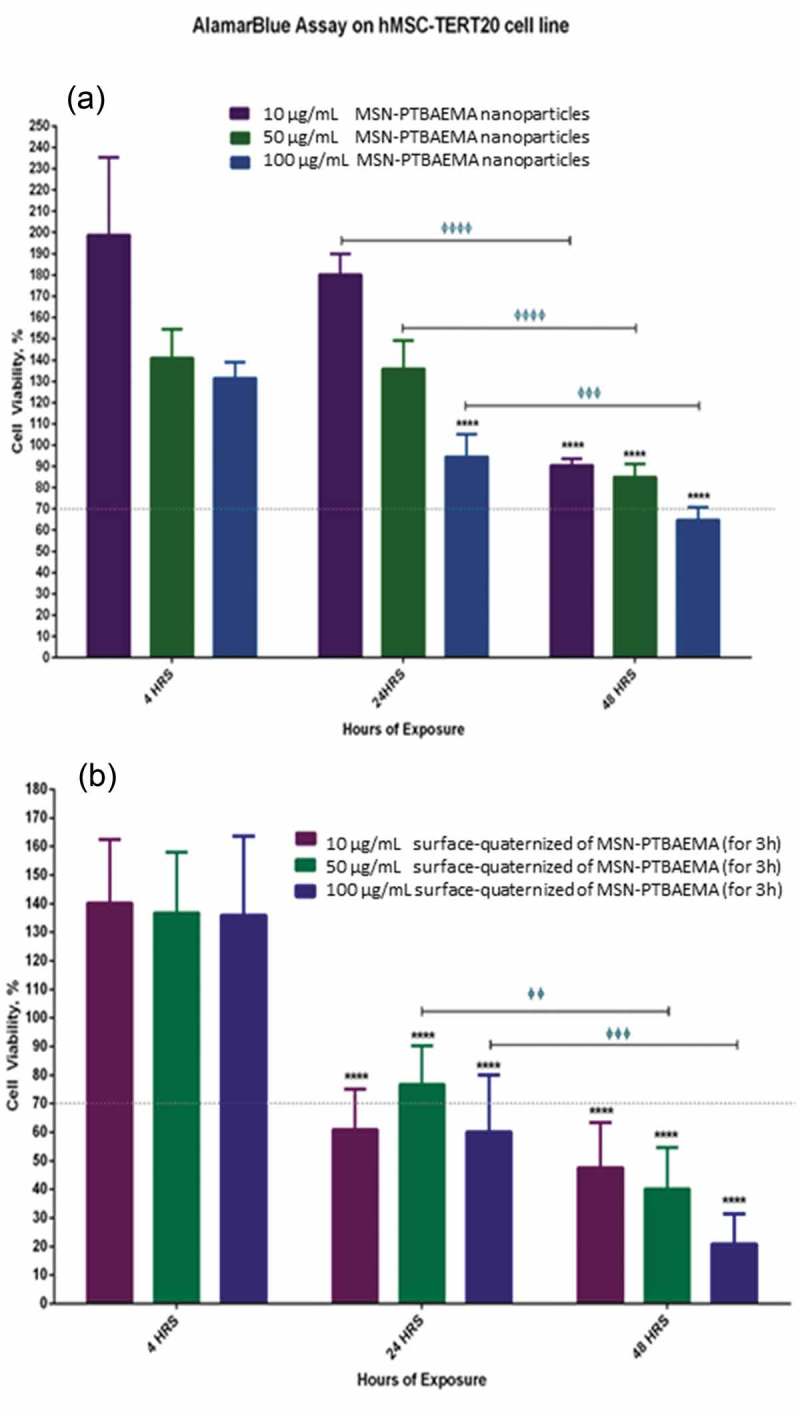
Figure 7.

Illustrations of the effect of MSN-PTBAEMA nanoparticles on cell viability of hMSCs (a) and the effect of surface-quaternized of MSN-PTBAEMA (for 3 h) nanoparticles on cell viability of hMSCs (b), after being exposed to the nanoparticles for 4, 24 and 48 h, and Sideway bars indicate significance for the same concentrations at different exposure times and astride indicate the level of significance as follows: *P > 0.05, **P > 0.01, ***P > 0.001, ****P > 0.0001.
