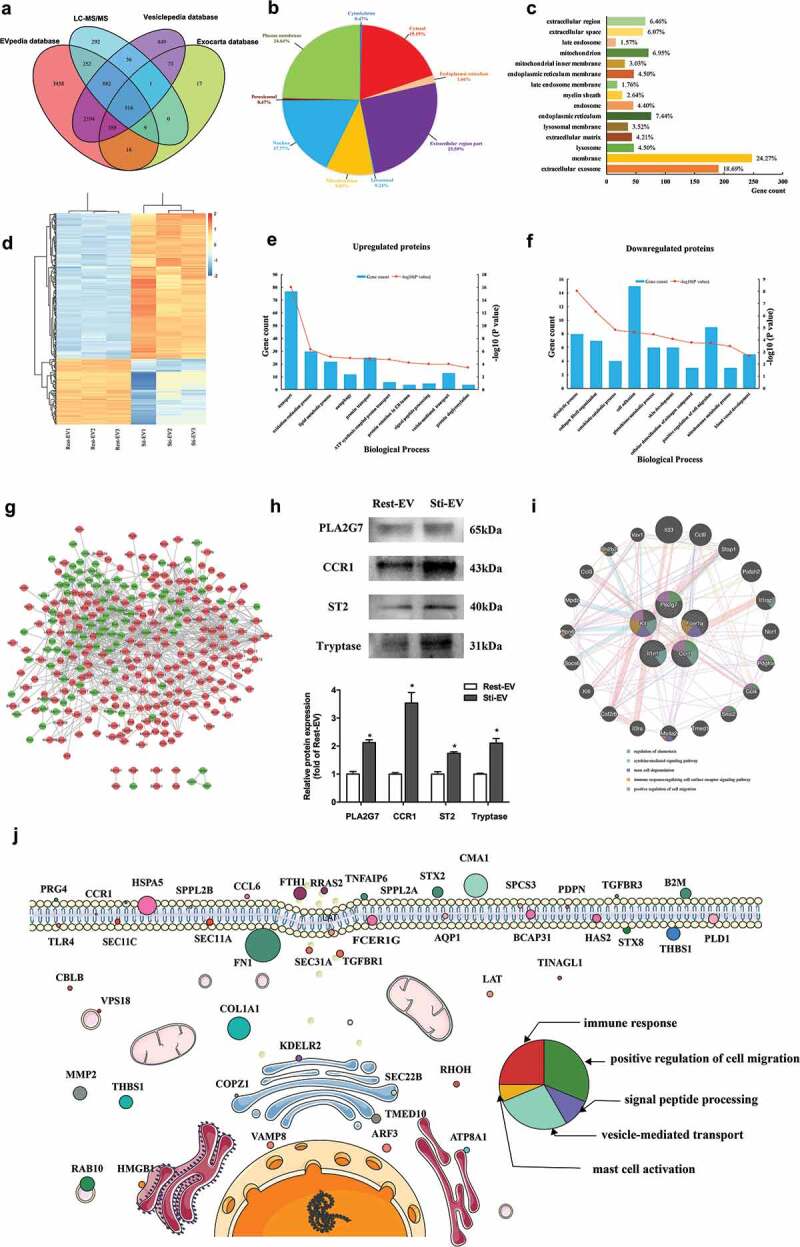
Figure 3.

Global profiling of proteins encapsulated in MC-derived EVs using Mass spectrometry. (a) Venn diagrams of proteins identified in MC-derived EVs by mass spectrometry. The total number of proteins identified was compared with results from the Exocarta database of published EVs proteomics. Intracellular protein locations of differential expression proteins (DEPs) were assigned by the WoLF PSORT online tool (b) and Gene Ontology annotations (c). (d) Hierarchical clustering analysis of a heat map of the 415 DEPs was performed by the package “pheatmap” in R programme, revealing that the molecular profile of each group is unique, with the biological replicates being closest together. The red colour indicates increased protein abundances in Sti-EV, and the green colour indicates increased protein abundances in Rest-EV. The 10 most significantly enriched GO biological processes (−log10(p values), p < 0.05) in proteomic data of EVs secreted from resting (e) and degranulated MCs (f) were identified in this study. (g) Protein–protein interaction (PPI) network analysis of DEPs identified via proteomic approaches based on TMT labelling was performed by Cytoscape software. Red nodes represent upregulated DEPs, and green nodes represent downregulated DEPs. (h) Western blotting analysis of indicated proteins was performed to validate the MS results. *p < 0.05. (i) Functional enrichment analysis of hub proteins from MC-derived EVs were carried out with the Genemania online tool. Red lines indicate physical interactions between proteins, and blue lines denote co-localization between proteins. The inner circle (stripes) shows pasted hub proteins, and the outer circle shows relevant proteins inferred from the literature. Coloured circles refer to the five most significant functions associated with proteins. (j) Schematic diagram representation of subcellular distribution of proteins that were enriched in several significant pathways. The size of circles refers to the expression levels of proteins identified by mass spectrometry. The colour of circles represents the pathways that were enriched.
