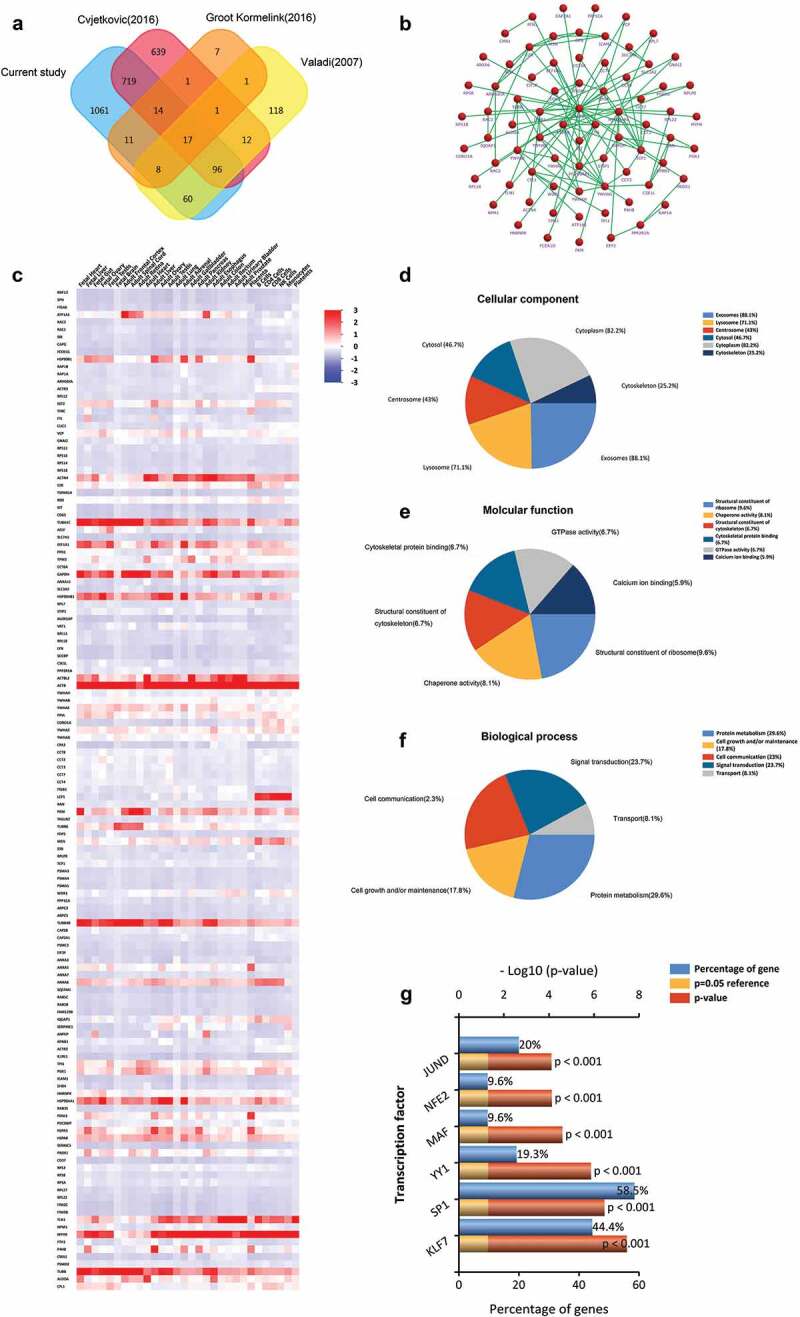
Figure 4.

Comparison of BMMC-derived EVs with published MCs EVs data in the proteome. (a) Venn diagram of total proteins from all identified BMMC-derived EVs proteins and the EVpedia and Vesiclepedia databases, showing common and unique proteins. (b) Enriched direct protein–protein interaction network from common proteins. (c) Distribution of these molecules mapping to other cells. Functional classification of the common exosomal proteins annotated by Gene Ontology. Pie charts represent the assigned classification of (d) cellular components, (e) molecular functions and (f) biological process. (g) The transcription factors associated with these overlapped proteins were analysed by FunRich. KLF7, SP1, YY1, MAF, NFE2 and JUND were significantly expressed among overlapped EVs proteins (p < 0.001).
