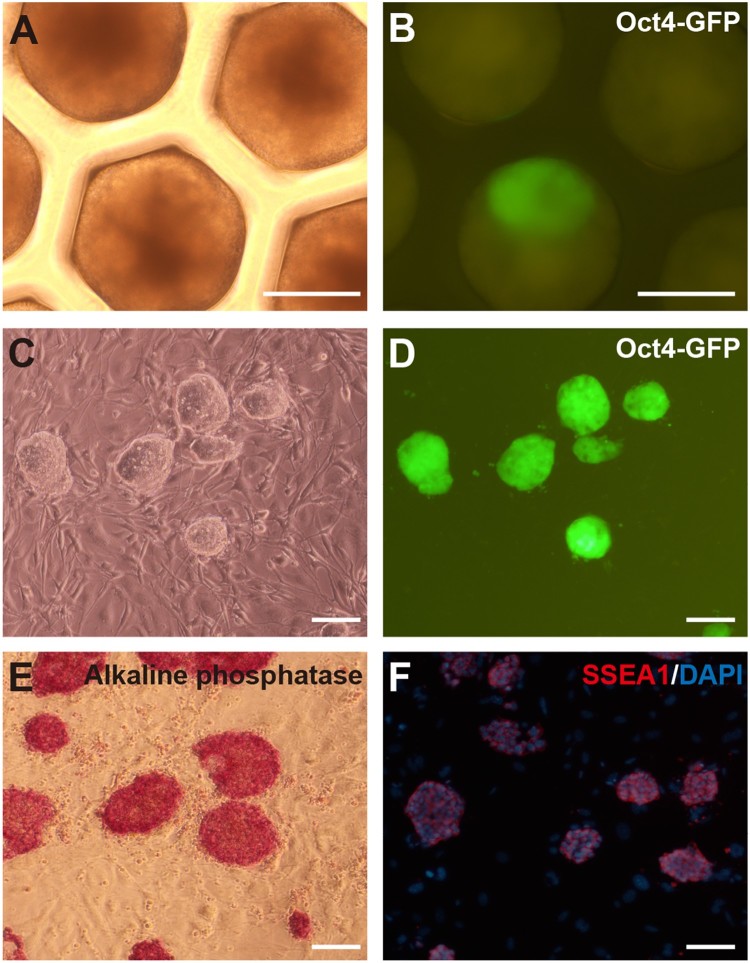
Figure 2.
Induction of SF-gPSCs. (A, B) Representative (A) phase contrast and (B) GFP-positive images of the conversion of SSCs into gPSCs in a 3D scaffold. (C, D) Representative (C) phase contrast and (D) GFP-positive images of SF-gPSCs from Oct4-GFP-expressing colonies. (E) Immunofluorescence staining of alkaline phosphastase in SF-gPSCs. (F) SSEA1 staining in SF-gPSCs. Scale bars: 200 μm (A–G).

