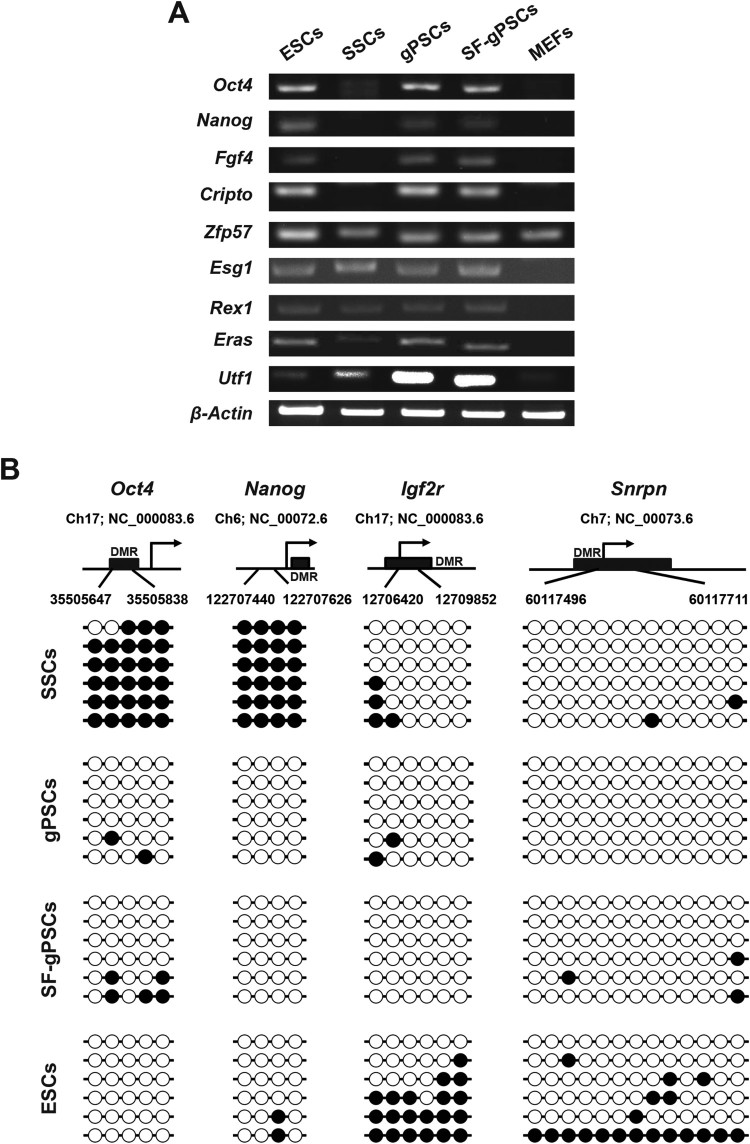
Figure 3.
RT-PCR analysis of pluripotency marker gene expression and DNA methylation analysis. (A) Expression of pluripotency marker genes was analyzed by RT-PCR in ESCs, SSCs, gPSCs, SF-gPSCs, and MEFs. (B) DNA methylation patterns of Oct4, Nanog and the maternally methylated genes Snrpn and Igf2r in ESCs, SSCs, gPSCs, and SF-gPSCs. Each line represents a single clone. Black and white circles represent methylated and unmethylated CpGs, respectively.

