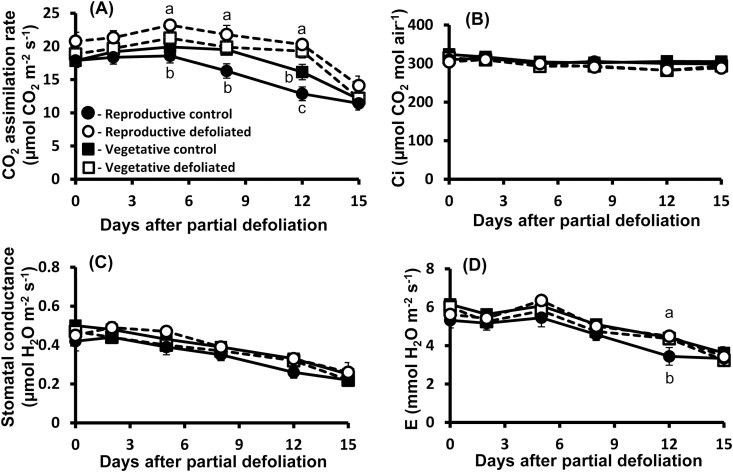
Fig. 2.
Effect of source–sink relationship on the photosynthetic activity response to partial defoliation. Photosynthetic rate (A), Ci, CO2 concentration in the intercellular space (B), stomatal conductance (C), and transpiration rate (D) of remaining tomato leaves after partial defoliation of the other leaves (open symbols). Defoliations were performed on either young plants at the vegetative stage (squares) or mature plants at the reproductive stage (circles) in a temperature-controlled greenhouse (25 °C/18 °C day/night). Broken lines and open symbols represent partially defoliated plants; solid lines and closed symbols represent control plants. Student’s t-test was used to compare mean values of six plants. Different lower case letters indicate a significant difference at P<0.05.

