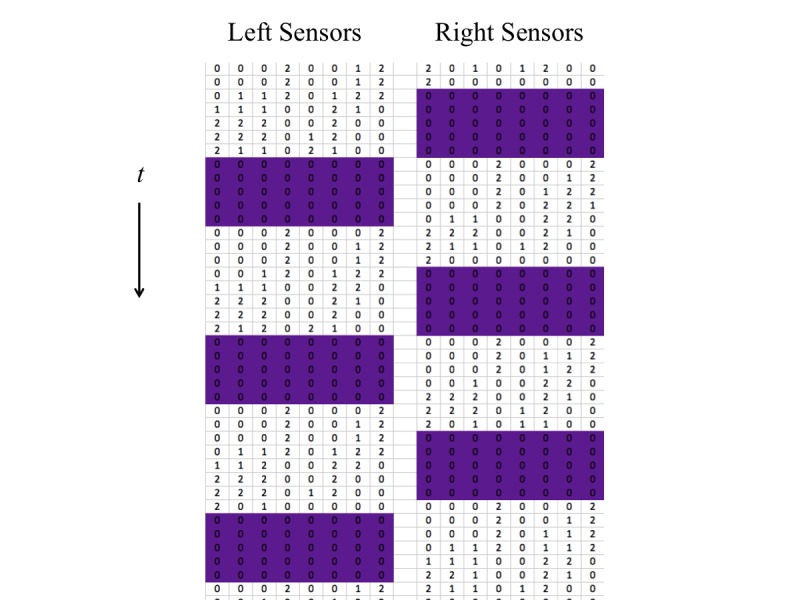
Figure 2.

A sample of 4 seconds of raw data from the pressure sensors. The vertical position of each number of the array indicates the time, ordered from top to bottom at an increment of 0.1 seconds. Each column denotes a sensor, with left foot and right foot separated. The colored portions indicate when our algorithm decided the foot was off the ground.
