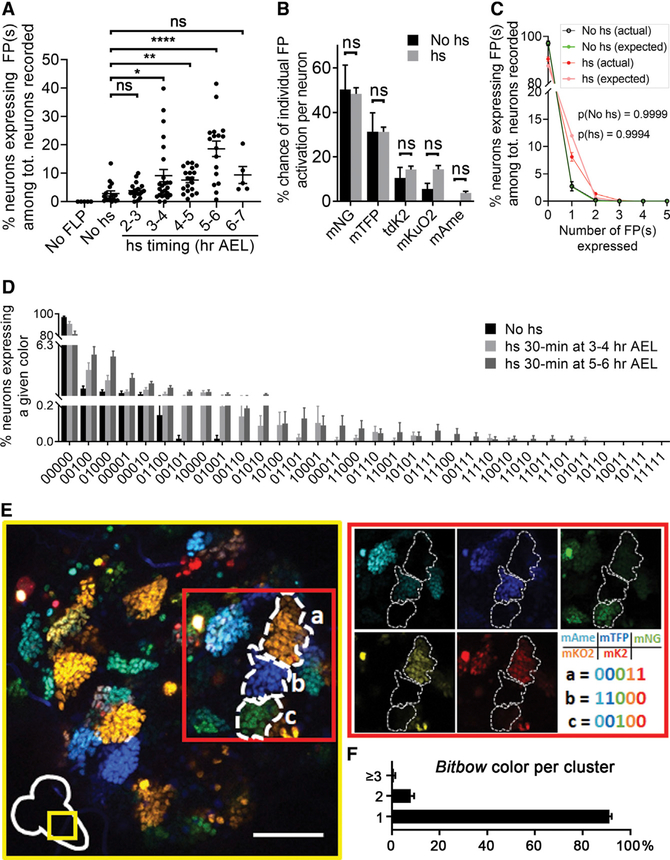
Figure 2. Labeling and Lineage Tracing Efficacy of nBitbow in the Drosophila Nervous System.
(A) Quantification of the labeling coverage of nBitbow by heat shock FLP induction in the PNS at various time points during early embryonic development. Sample numbers (larvae): no FLP, 5; no hs, 16; 2–3 h AEL, 18; 3–4 h AEL, 25; 4–5 h AEL, 19; 5–6 h AEL, 17; 6–7 h AEL, 5. The p values were calculated by Dunn’s multiple comparison test. ns, p > 0.05; *0.01 < p ≤ 0.05; **0.001 < p ≤ 0.01; ***0.001 < p ≤ 0.001; and ****p < 0.0001.
(B) Comparison of the turn-on efficiency of each FRT-nucFP-FRT module in the PNS. Heat shock (hs) data are the combined data from hs at 2–3, 3–4, 4–5, 5–6, and 6–7 h AEL. Sample numbers (larvae): no hs, 16; hs, 81. The p values were calculated by multiple comparison using the Holm-Sidak method.
(C) The actual FP frequency distribution is not different from the theoretical distribution (expected) as the number of activated FP increases in the PNS. This indicates that the recombination of each FRT-nucFP-FRT module is independent of each other. Sample numbers (larvae): no hs, 15; hs, 81. The p values were calculated by the chi-square goodness-of-fit test for Poisson distribution.
(D) 27 color codes were observed with different frequencies in the PNS from a Drosophila line that carries only one nBitbow cassette. Sample numbers (larvae): no hs, 15; 3–4 h AEL, 25; 5–6 h AEL, 17.
(E) Representative images of nBitbow labeling in thoracic segments in the CNS of the third-instar larvae with embryonic heat shock FLP induction. Most cell clusters (i.e., lineage clones) were labeled with the same color. 193 clusters were analyzed. Scale bar: 50 μm.
(F) Proportion of thoracic lineage clones labeled by one, two, or more Bitbow color tags, quantified across n = 193 clusters. The p values were calculated using unpaired two-tailed t test, and α of 0.05 is used as the cutoff for significance. Error bars: SEM.

