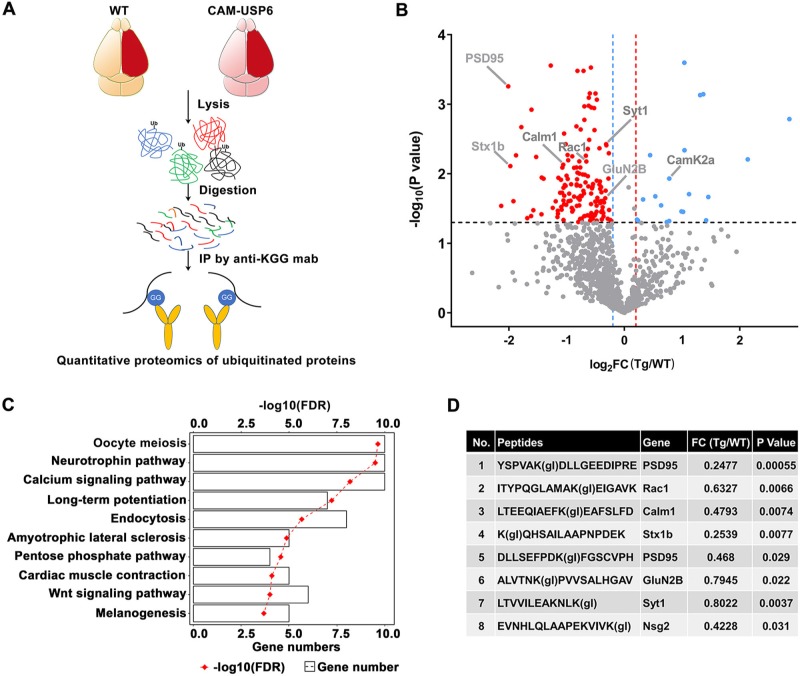
Fig 4. Quantitative proteomic profiling of USP6-regulated proteins and signaling pathways.
(A) Schematic diagram depicting the quantitative proteomics pipeline used to identify differentially ubiquitinated proteins in CAM-USP6 Tg mouse brain. (B) Volcano plot indicating ubiquitinated protein species identified in CAM-USP6 compared with WT mouse brain cortex; colored plots represent significantly down-regulated (blue) and up-regulated (red) proteins. Log10 P value (t test, y-axis) and FC (log2FC, CAM-USP6 versus WT, x-axis) are shown. Significance cutoffs were set to P < 0.05, FC > 1.2. (C) KEGG analysis of 175 differentially regulated proteins identified in CAM-USP6 versus WT mouse cortex. (D) Differentially ubiquitinated synaptic protein components identified in CAM-USP6 (compared with WT) mouse cortex. The underlying data for this figure can be found in S1 Data. Calm1, Calmodulin 1; CAM, CamK2a; CamK2a, calcium/calmodulin dependent protein kinase II alpha; FC, fold change; FDR, false discovery rate; Glu, glutamate ionotropic receptor; IP, immunoprecipitation; KEGG, Kyoto encyclopedia of genes and genomes; KGG, anti-di-glycine remnant; PSD, postsynaptic density; Rac1, Rac family small GTPase 1; Stx1b, syntaxin 1B; Syt1, synaptotagmin 1; Tg, transgenic; USP, ubiquitin-specific protease; WT, wild-type.

