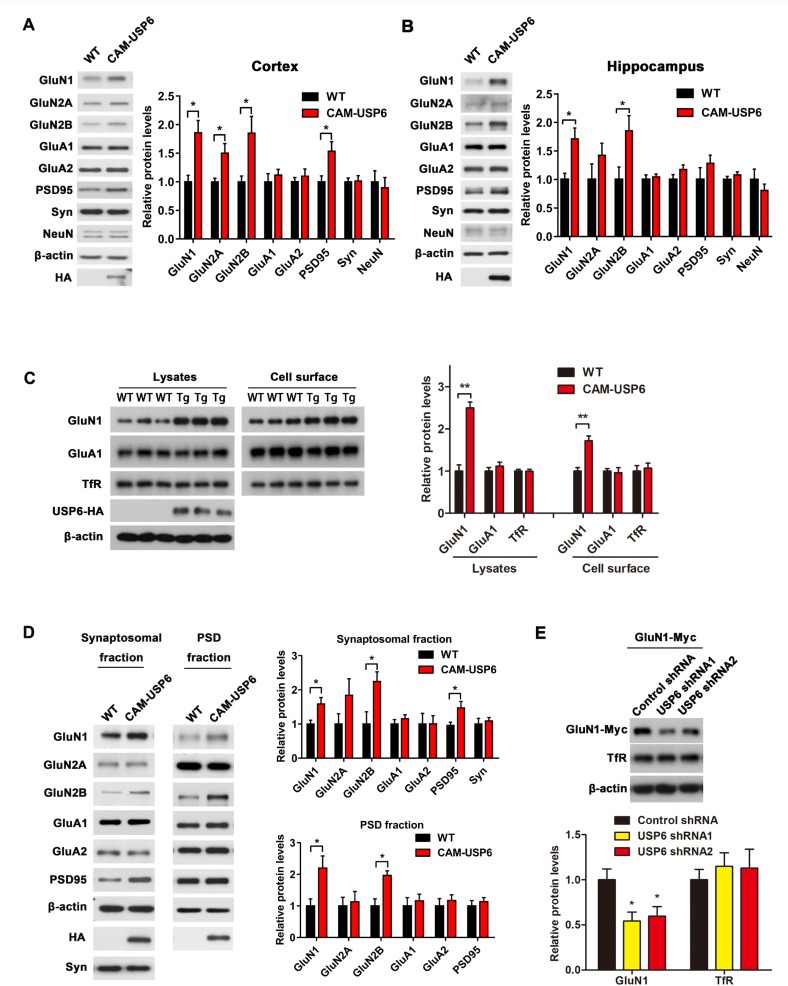
Fig 5. Characterization of NMDA receptors as potential USP6 substrates.
(A and B) Immunoblot analysis of GluN1, GluN2A, GluN2B, GluA1, GluA2, Syn, PSD95, and NeuN in WT and CAM-USP6 mouse cortex (A) and hippocampus (B). Data represent means ± SEM. Signal intensities from immunoblots were calculated and normalized to β-actin. n = 4 mice. *P < 0.05 as determined by Student t test. (C) Immunoblot analysis of cell surface GluN1 levels in primary neurons from E18.5 CAM-USP6 mouse embryos; band densities were normalized to β-actin. n = 3 mice, **P < 0.01 as determined by Student t test. (D) Glutamate receptor subunit levels (GluN1, GluN2A, GluN2B, GluA1, GluA2) and PSD95 in synaptosomal and PSD fractions derived from WT and CAM-USP6 mouse cortex. Data represent means ± SEM. Signal intensities from the immunoblots were normalized to β-actin. n = 4 mice, *P < 0.05 as determined by Student t test. (E) Immunoblot analysis of GluN1 levels in GluN1-expressing HEK293T cells transfected with USP6 shRNAs. The signal intensities of the immunoblots were normalized to β-actin. n = 3, *P < 0.05 as determined by one-way ANOVA with Tukey’s post hoc analysis. The underlying data for this figure can be found in S1 Data. CAM, CamK2a; Glu, glutamate ionotropic receptor; HA, hemagglutinin; NeuN, neuronal nuclei antigen; NMDA, N-methyl-D-aspartate; PSD, postsynaptic density; shRNA, short hairpin RNA; Syn, synaptophysin; TfR, transferrin receptor; Tg, transgenic; USP, ubiquitin-specific protease; WT, wild-type.

