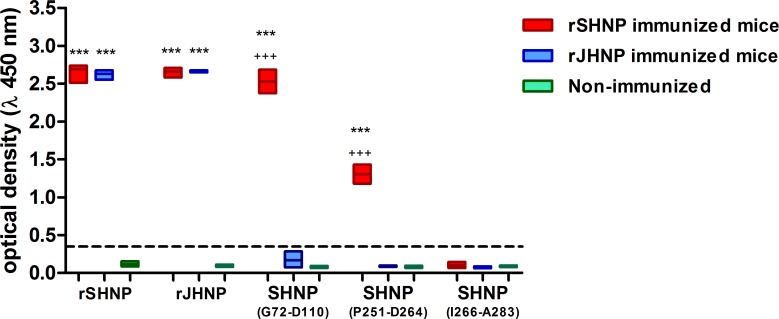
Fig 2. Evaluation of cross reactivity against rSHNP, rJQNP, SHNP(G72-D110), SHNP(P251-D264) and SHNP(I266-A283) elicited by immunization with rSHNP and rJHNP.
Bars represent the optical densities of mice immunized with rSHNP (red bars, n = 3) and immunized with rJHNP (blue bars, n = 3) and non-immunized mice (green bars, n = 6). Traced line indicates the value of Cut-off, defined as 3 times the mean of non-immune optical densities. Data is presented as floating bars with lines indicate minimum, mean and maximum values. Values higher than cut-off were considered responder to antigen and compared by test-T against other groups. * represents difference between immunized groups and non-immunized mice, while + represents statistical differences between immunized groups.

