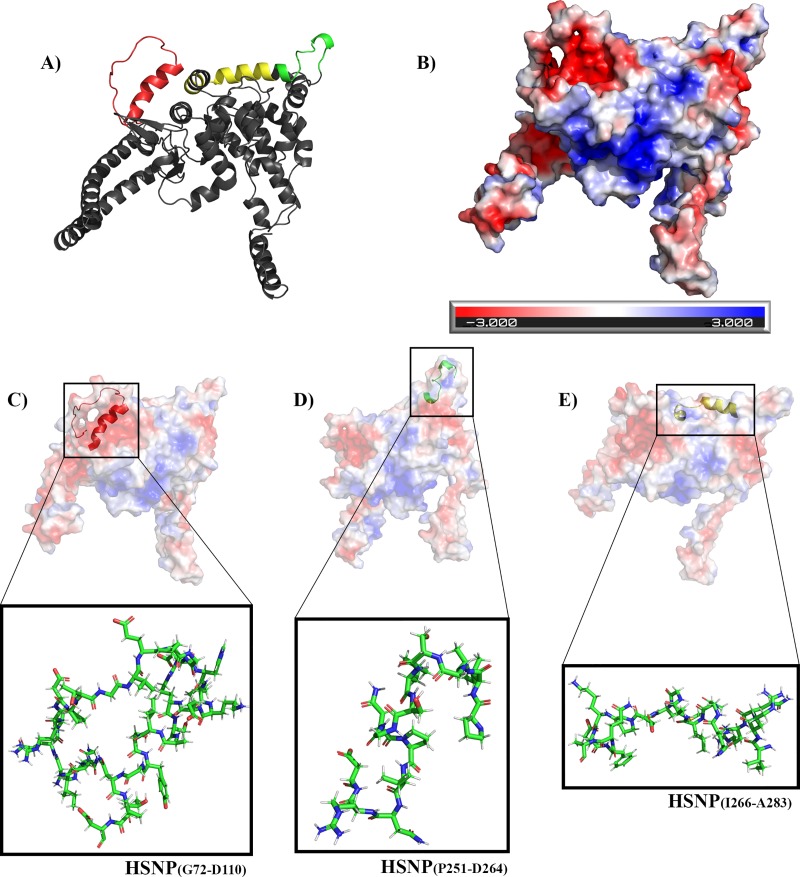
Fig 3. Predicted SHNP homology model.
(A) SHNP representation as cartoon with predicted linear peptides spatial localization represented by colors where: red—SHNP(G72-D110); green—SHNP(P251-D264); yellow—SHNP(I266-A283). (B) SHNP electrostatic potential surface representing the positive (blue) and negative (red) charges of predicted protein. Peptides sticks representations of SHNP(G72-D110) (C), SHNP(P251-D264) (D), SHNP(I266-A283) (E) and their respective locations and electrostatic characteristics on the protein surface; SHNP(G72-D110) is in a more electronegative region whereas SHNP(P251-D264) and SHNP(I266-A283) are found in regions with more neutral features.

