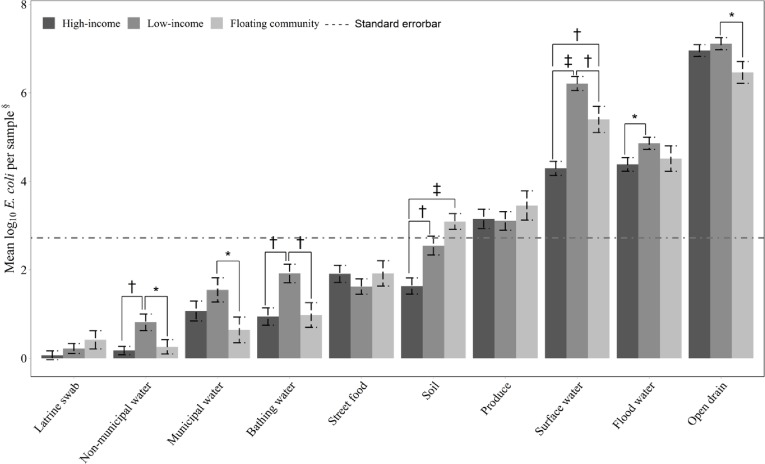
Fig 2. Mean log10 E. coli concentrations in environmental samples from 10 study neighborhoods in Dhaka City, 2017.
Unit of measurements used: all water samples (per 100 mL), latrine swab (per swab), produce (per single serving), street food (per gram), and soil (per gram). The horizontal dotted line signifies the mean E. coli concentration of all samples (N = 1000). *Level of significance at P <0.05 †Level of significance at P <0.01 ‡Level of significance at P <0.001 §Unit of measurement: all water samples (per 100 mL), latrine (per swab), produce (per single serving), street food (per gram), Soil (per gram).

