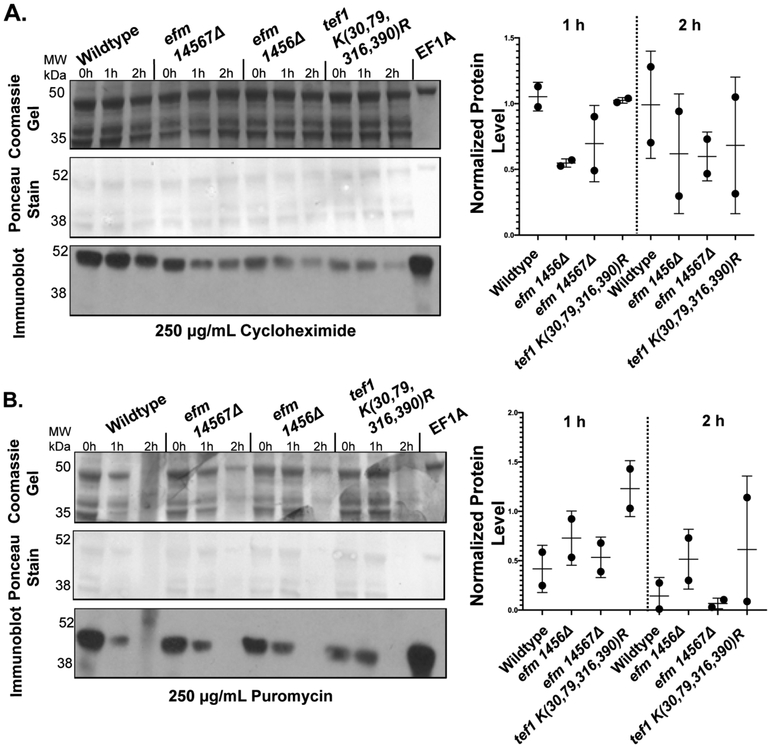
Figure 8: EF1A protein levels remain equally stable in the presence of cycloheximide and puromycin in wildtype cells and in cells deficient in EF1A methylation.
Yeast cells were grown to an OD of about 0.7 at 600 nm in YPD media at 30 °C. Cycloheximide (A) or puromycin (B) was then added individually to 3 mL of cells containing 7.5 OD600nm to a final concentration of 250 μg/ml. One mL aliquots of the 7.5 OD600nm cells were collected at the indicated times per strain and drug condition, lysed (using method 2) and then the proteins were fractionated by SDS-PAGE as described in the "Experimental Procedures" section. A representative gel and immunoblot is shown for both conditions. The top panel shows a Coomassie-stained gel. The middle panel is a Ponceau S-stained PVDF membrane from a duplicate gel. An immunoblot using antibodies to EF1A is shown in the lower panel. This experiment was performed twice for cycloheximide and twice for puromycin. The relative EF1A protein levels in each wildtype or mutant strain at the 1 h or 2 h time points compared to the EF1A level of the same strain at the zero time point were quantified using Image J densitometry and is shown to the right of its respective drug condition.

