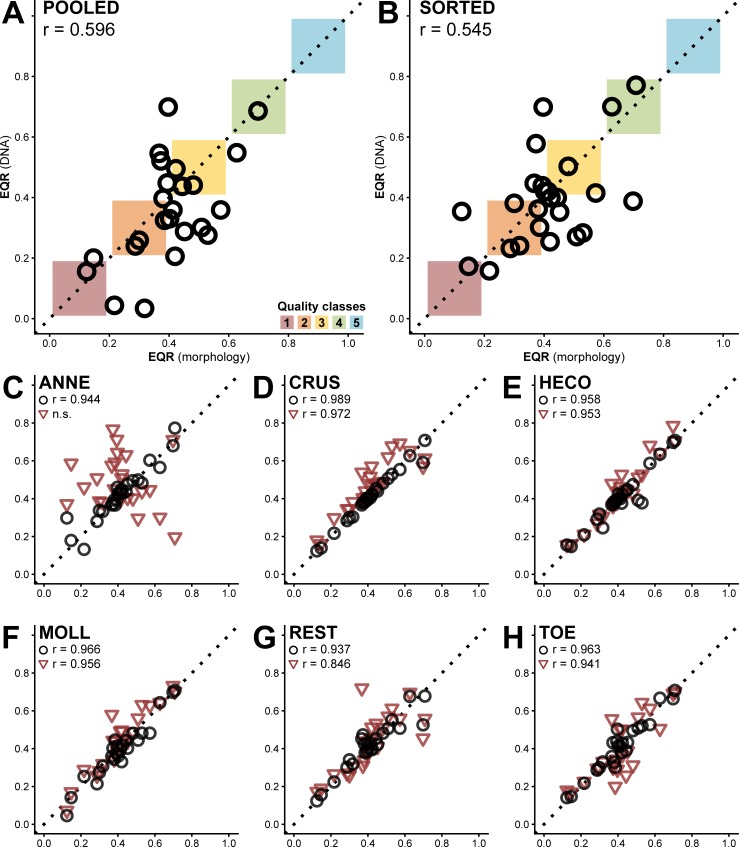
Fig 3. EQR scores.
Comparison for the EQR score calculated on morphological data versus the score calculated on DNA data for (A) the pooled and (B) the sorted and separately sequenced samples. Both showed a moderate correlation between the scores (Pearson correlation, p = 0.002 and 0.005, respectively). Better correlations were found when only replacing one of six taxon groups with molecular data (on the y-axis): (C) Annelida, (D) Crustacea, (E) Heteroptera and Coleoptera, (F) Mollusca, (G) Chironomidae and other Diptera and (H) Trichoptera, Odonata, and Ephemeroptera (black circles, Pearson correlation values provided in the panels, p < 0.001 for all groups). To assess the influence of each of the respective groups on the EQR score, the original scores (x-axis) were also compared to EQR scores where one taxon group was completely removed (y-axis) from the taxon list before the analysis (C-H, red triangles, Pearson correlation values provided in the panels, p < 0.001 for all groups).

