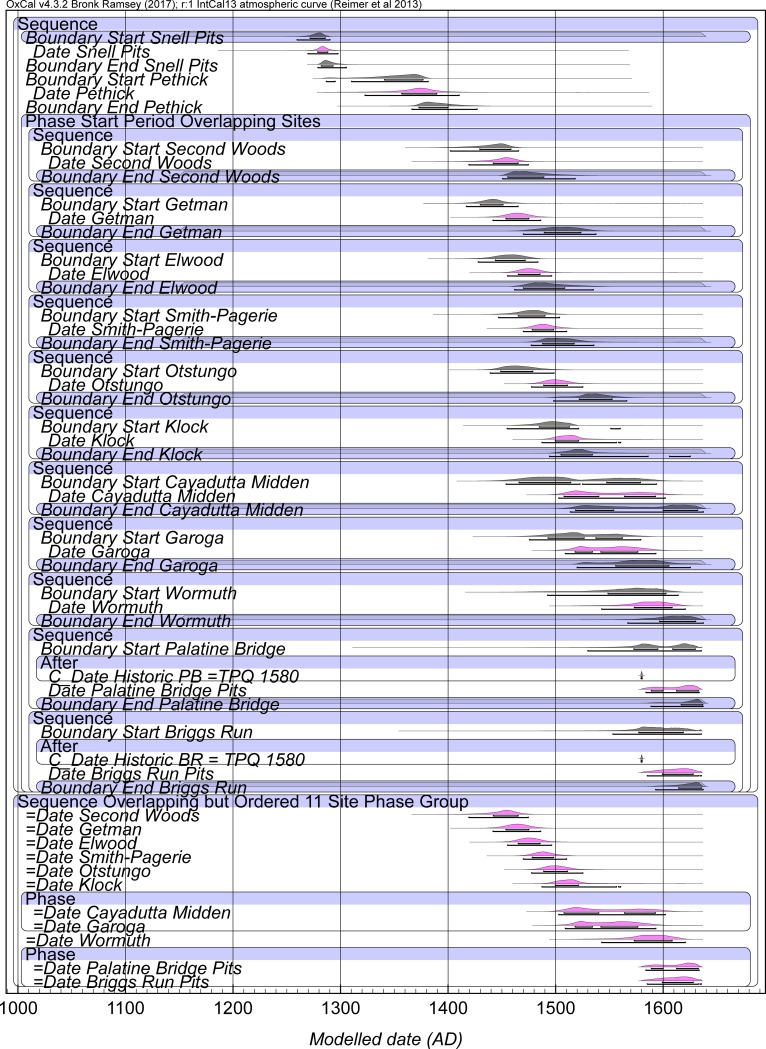
Fig 4. Model 3A selected elements with site Phase Intervals constrained (uniform probability) to 0–100 years.
Data from OxCal [23, 38] and IntCal13 [22] with curve resolution set at 1 year. Example shown with OxCal Amodel = 80.9 and Aoverall = 70. For full Model 3, see S7 File. Start and End Boundaries in Black, Date estimates for each site Phase in magenta. Lines under the histograms indicate the 68.2% and 95.4% hpd ranges. The separate but cross-referenced Sequence of the Date estimates is shown at the bottom of the main model (see Methods)—note (i) Cayadutta + Garoga and (ii) Palatine Bridge + Briggs Run are considered as potentially coeval (and floating against each other). As in Fig 3, Historic BR and Historic PB refer to the TPQ of 1580 applied to Briggs Run and Palatine Bridge (as noted in this figure).

