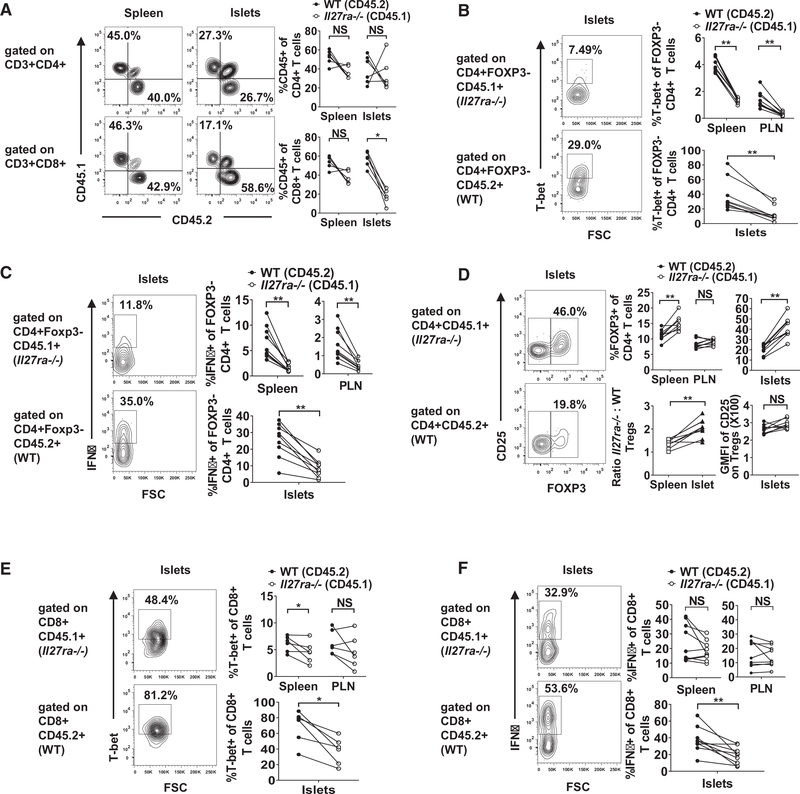
Figure 5. IL-27 Signaling Intrinsically Modulates CD4 and CD8 T Cell Subsets.
Lethally irradiated (NOD 3 NOD.Cd45.2)F1 mice were infused with equal numbers of T cell-depleted BM cells from NOD.Cd45.2 and NOD.Il27ra−/− donors. Pre-diabetic recipients were analyzed for wild-type (CD45.2+) and IL-27Rα-deficient (CD45.1+) T cell subsets 10–12 weeks after BM reconstitution.
(A) Frequencies of total CD4 and CD8 T cells in the spleens and islets of the mixed BM chimeras. Representative flow cytometry profiles are shown in the left panels, and summarized results are presented in the right panels. Summarized results are representative of at least two independent experiments.
(B) T-bet expression in CD3+CD4+Foxp3− T cells in the spleens, PLNs, and islets of mixed BM chimeras. Representative flow cytometry profiles are shown in the left panels, and summarized results are presented in the right panels.
(C) IFNγ production in CD3+CD4+Foxp3− T cells in the spleens, PLNs, and islets of mixed BM chimeras. Cells were stimulated with PMA and ionomycin. Representative flow cytometry profiles are shown in the left panels, and summarized results are presented in the right panels.
(D) Frequencies of CD3+CD4+Foxp3+ Tregs in the spleens, PLNs, and islets of the mixed BM chimeras. Representative flow cytometry profiles are shown in the left panels, and summarized results are presented in the upper middle and right panels. The ratios of IL-27Rα-deficient to wild-type Treg frequencies in spleens versus islets are shown in the lower middle panel. The levels of CD25 expression are summarized in the lower right panel.
(E) T-bet expression in CD3+CD8+ T cells in the spleens, PLNs, and islets of mixed BM chimeras. Representative flow cytometry profiles are shown in the left panels, and summarized results are presented in the right panels.
(F) IFNγ production in CD3+CD8+ T cells in the spleens, PLNs, and islets of mixed BM chimeras. Cells were stimulated with PMA and ionomycin. Representative flow cytometry profiles are shown in the left panels, and summarized results are presented in the right panels.
All summarized data in (B)–(F) are from two independent experiments. Statistical significance was determined using Wilcoxon matched-pairs signed rank test (*p < 0.05, **p < 0.01, and ***p < 0.005). NS, not significant. GMFI, geometric mean fluorescence intensity. See also Figure S5.

