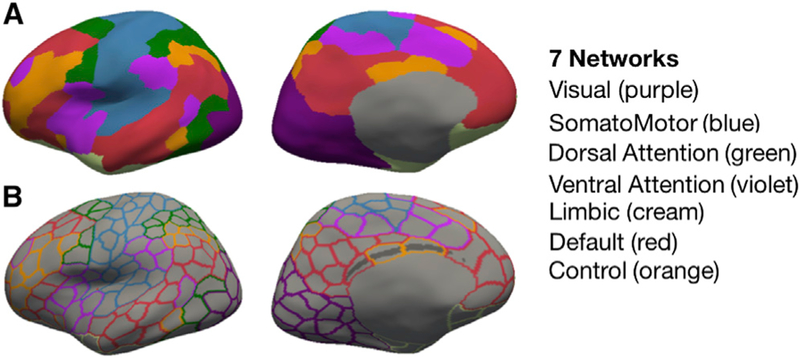
Figure 2. Parcellation Scheme.
Displayed as example on the left inflated hemisphere (fsaverage6 template) are (A, upper row) seven color-coded resting-state-derived connectivity networks (Yeo et al., 2011) (see color to network legend on the right) and (B, lower row) 200 outlined parcels (from the 400 whole-brain parcellation; Schaefer et al., 2018).

