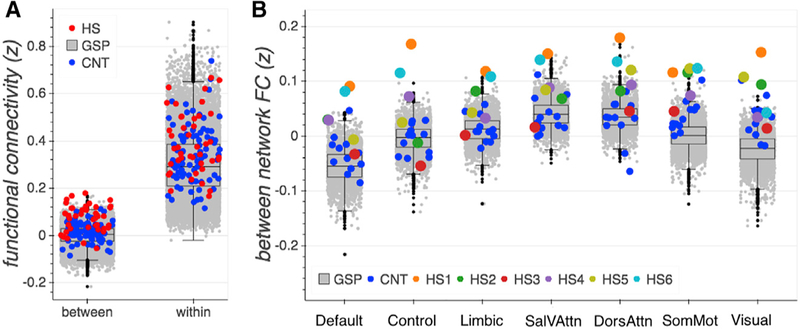
Figure 4. Functional Connectivity.
(A) Between- and within-network functional connectivity averaged across networks per group (GSP, CNT, and HS) (seven data points, one for each network, per participant). CNT and HS showed similar within-network connectivity as compared to the large GSP sample, while overall between-network connectivity was notably stronger for HS participants.
(B) High between-network connectivity was evident across all networks and in all but one (HS3) hemispherectomy participant.
Boxplots represent distribution of the GSP data. FC, functional connectivity; Sal/VAttn, salience and ventral attention network; DorsAttn, dorsal attention network; SomMot, somatosensory/motor network; z, Fisher’s r to z transformed correlation coefficient. See also Tables S4, S5, and S9.

