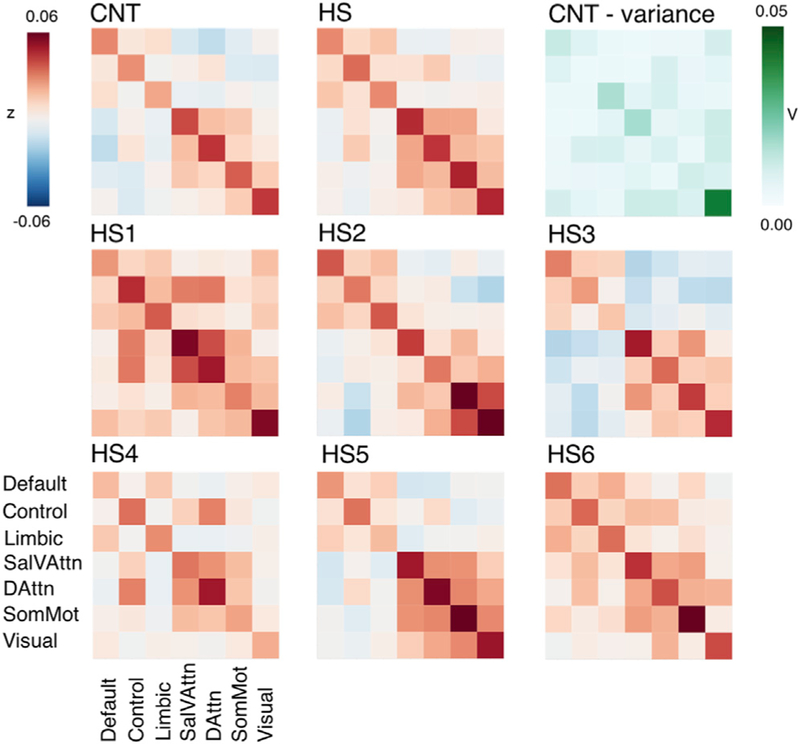
Figure 5. Functional Connectivity Correlation Matrices across Networks.
Upper row: averaged connectivity between networks (diagonal = within, off diagonal = between) for the CNT control group (left) showed typical relations between known functional networks (e.g., anticorrelation of default and attention networks). Comparable yet overall stronger connectivity was found across the HS sample (middle). Differences between CNT and HS connectivity did not seem to be pronounced in connections that show greater variance in controls (right). Middle and lower row: connectivity matrix per hemispherectomy participant revealed individual characteristics; between-network connectivity patterns of HS2, HS3, and HS5 were most comparable to controls, while HS4 showed weaker anticorrelations between default and attention networks. HS1 and HS6 showed the strongest connectivity between almost all networks. Sal/VAttn, salience and ventral attention network; DorsAttn, dorsal attention network; SomMot, somatosensory/motor network; V, variance; Z, Fisher’s r-to-z transformed strength of correlation. See also Table S6.

