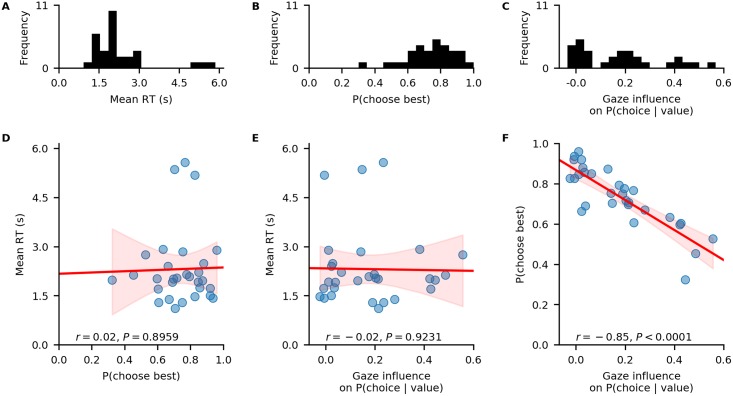
Fig 3. Individual differences in the data.
A-C: distributions of individuals’ mean RT (A), probability of choosing the highest-valued item in a trial (B), and behavioural influence of gaze allocation on choice behaviour (C). D-F: associations between individuals’ probability of choosing the highest-valued item and mean RT (D), individuals’ behavioural influence of gaze allocation on choice behaviour and their mean RT (E), individuals’ behavioural influence of gaze allocation on choice behaviour and their probability of choosing the highest-valued item (F). Red lines indicate linear regression fits with confidence bands surrounding them. Pearson’s r coefficients with corresponding P-values are reported for each association in D-F.

