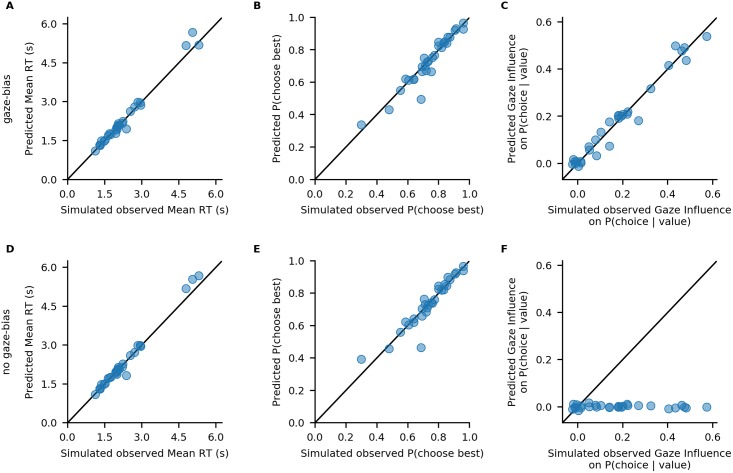
Fig 5. Out-of-sample model fits.
Comparison of individuals’ simulated observed response behaviour with the out-of-sample predictions of a GLAM variant with (A-C) and without gaze bias (D-F): Individuals’ mean RT (A, D), probability of choosing the best item (B, E), and influence of gaze allocation on choice probability (C, F). Points indicate individual participant means.

