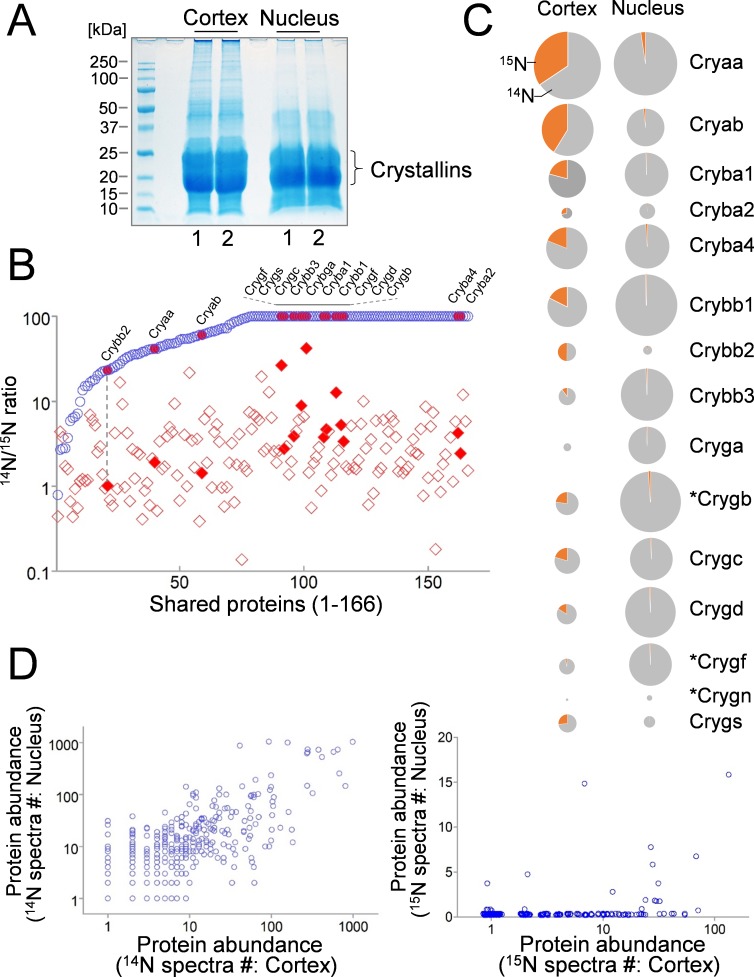
Figure 3. Comparison of lens cortex and nucleus proteins by 14N/15N ratios.
(A) Lens tissues from the the cortex and the nucleus were separately harvested and subsequently resolved by SDS-PAGE. Prominent gel bands of Crystallins were present in both cortex and nucleus fractions, whereas in the higher molecular weight areas of the gel the cortex tissue appeared more intensely stained for its protein contents. (B) A direct comparison of 166 proteins identified in both cortex (red diamond) and nucleus (blue circle) plotted along the x-axis with their 14N/15N ratios separately plotted against the y-axis. In all proteins their 14N/15N ratios were higher in the nucleus (an arbitrary ceiling of the ratios was set at 100 that reflects no protein turnover). There was a wide range of the ratios among individual proteins in the cortex, including all subtypes of Crystalline (filled shapes in red). The ratio values for nuclear Crystallins are also indicated with filled circles at the corresponding x-axis positions (example illustrated by the dotted line). (C) When individual Crystallin isoforms are compared with respect to their abundance (circle size) in the cortex and the nucleus, there is a general trend of more γ-Crystallins (Cryg) in the nucleus with similar α- and β-Crystallin (Crya and Cryb) contents as compared to the cortex. The 14N/15N ratio indices (pie-chart) among these isoforms in the cortex were also different. Asterisks: Crystallins that are not expressed in human lens. (D) Total spectra counts that reflect the relative abundance of individual proteins were plotted for cortex vs. nucleus distributions. Among the old 14N-proteins there was a relatively balanced distribution between the two fractions (left panel). In contrast, the newer 15N-proteins were mostly concentrated only in the cortex (right panel).

