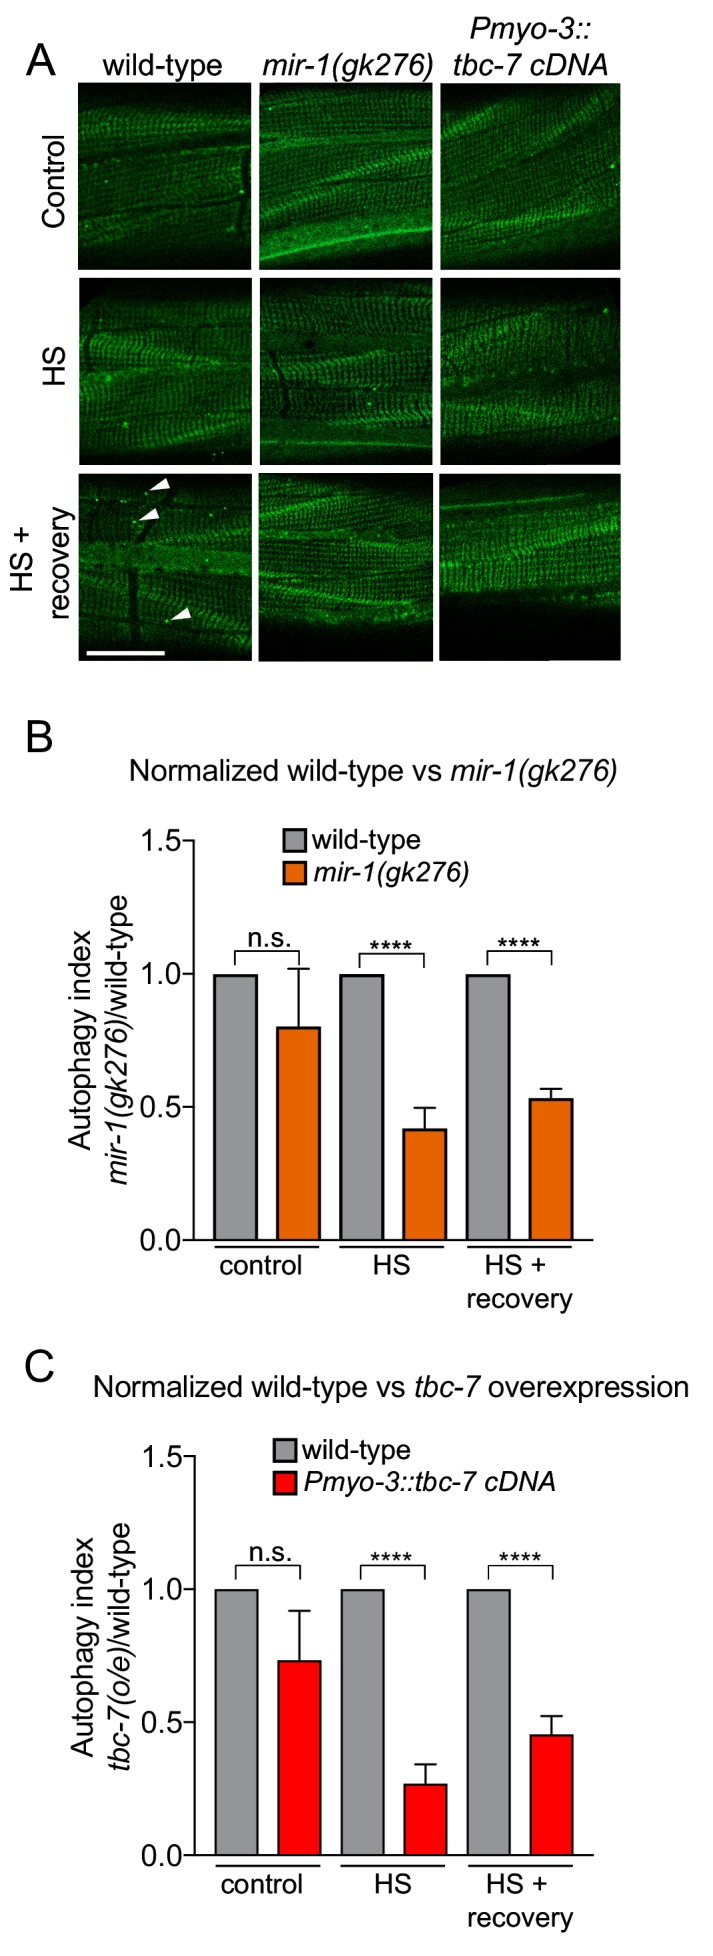
Figure 3. mir-1 and tbc-7 control stress-induced autophagy.
(A) Fluorescent images of BWM expressing GFP::LGG-1/Atg8 in wild-type, mir-1(gk276) and Pmyo-3::tbc-7 overexpressing animals under control conditions, immediately after heat shock for 1 hr at 35°C (HS) or 1 hr after recovery from heat shock at 15°C (HS + recovery). GFP::LGG-1 puncta = arrowheads. Scale bar, 10 μm. (B–C) Quantification of GFP::LGG-1/Atg8 puncta in BWM of animals and conditions shown in (A). The values represent the number of green puncta in mir-1(gk276) (B) and Pmyo-3::tbc-7 overexpressing (C) animals normalized to one green puncta in wild-type animals for each condition. n > 15. ± SEM ****p<0.0001, n.s. not significant (Welch's t-test).

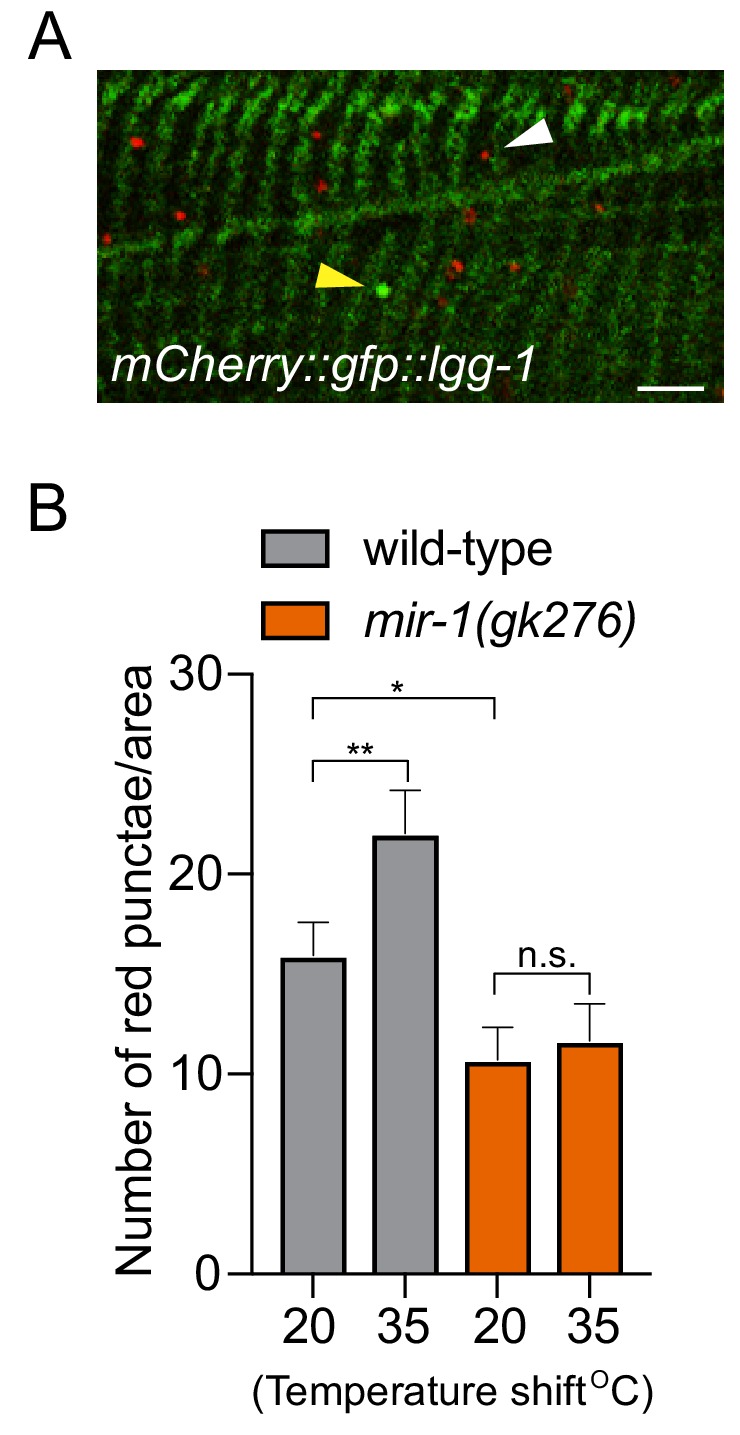
Figure 3—figure supplement 1. mir-1 controls stress-induced autophagy.

